Blog

Transit Gateway to RB VPN BGP Route filtering on VMC on AWS

Today I wanted to cover a topic that was recently raised by one of my customer about how to filter routes coming from a native TGW attached to an SDDC with a Route Based VPN.

There are currently no way to do it over the UI but it is possible through an API call to configure route filtering in and out with a Route Based VPN.

Let’s see how it is possible.

Route Based VPN attachment to a native Transit Gateway

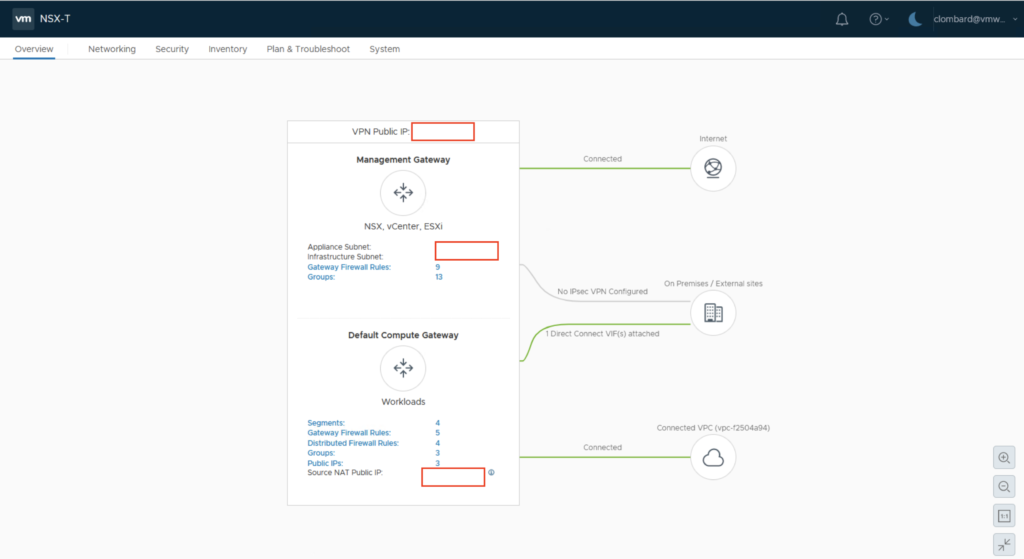
First thing I have created a route based VPN from my SDDC to a native Transit Gateway running on AWS.

The Transit Gateway is itself attach to a native VPC with 172.16.0.0/16 as subnet.

Let’s have a look at the VPN configuration in the SDDC and in the native AWS side.

AWS Transit Gateway VPN configuration

There is a site to site VPN configured with one tunnel (I didn’t configure two tunnels in that example).

The TGW is currently learning the SDDC subnets (see the 5 BGP ROUTES) including the management segment.

In order to see all the learned CIDRs, I need to display the Transit Gateway route table.

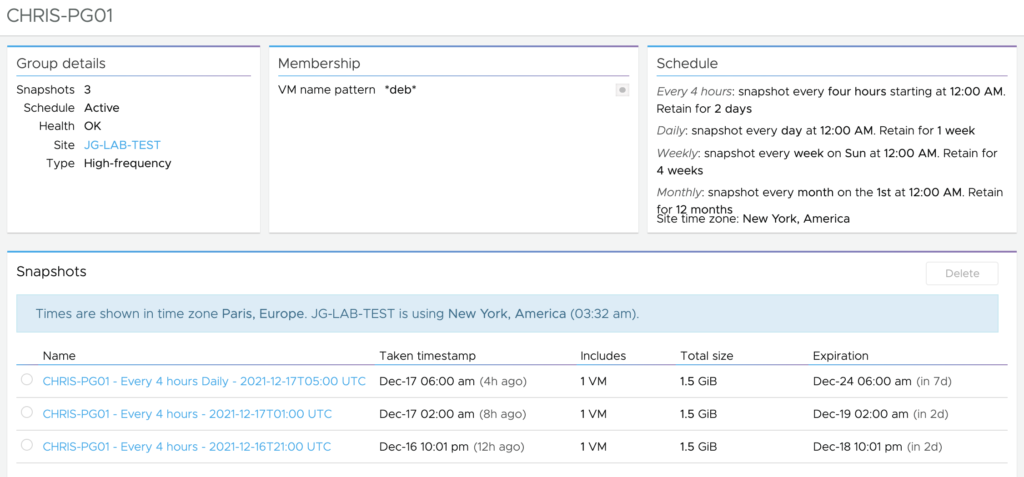
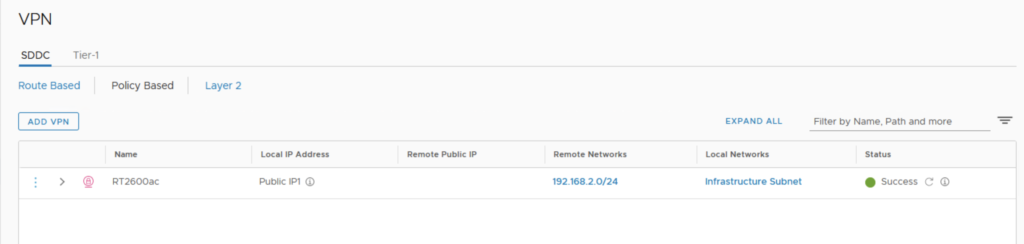
SDDC VPN configuration

If we look at the VPN configuration on the SDDC side, here is the result.

And if I click the View routes here

I can see the learned routes …

The SDDC is currently learning the VPC CIDR from the TGW.

and the Advertised routes.

I can confirm that by default everything is learned and advertised.

Let’s see how to limit the propagation of the routes from the TGW or the SDDC through an API call.

Installing and Configuring Postman

Download Postman

First I have downloaded Postman from here and installed it on my Mac laptop.

First thing you need to do when you have installed Postman is to create a new free account.

Click Create Free Account and follow the steps until finishing your free registration.

This will bring you to the following page with a default Workspace.

Import VMC on AWS Collections

Next thing you need to do is to import the VMC on AWS Collections and Environments variables that are directly available from VMware in the vSphere Automation SDK for REST. The VMware vSphere Automation SDK for REST provides a client SDK that contains samples that demonstrate how to use the vSphere Automation REST API and sample code for VMC on AWS and others.

Click on the download button of the Downloads section.

This will download a zip file that you need to extract.

This is going to redirect you to a Github repo. Just click on the green button called “Code” and pick Download.

Once you have downloaded, select the two following files: VMC Environment.postman_collection.jsonandVMware Cloud on AWS APIs.postman_collection.json and Import both into your Postman workspace.

This will add the collection with different sub folders.

Configuring VMC on AWS environments in Postman

If you click on the Environments section on the Left, you can setup multiple environment variables here including the SDDC ID, ORG ID and a refresh token.

Start by generating an API token, grab the information of SDDC from CSP Console and copy them in the CURRENT VALUE column.

Add the following variables with the following values:

Configuring the VMC APIs Authentication

Once you have downloaded the VMC on AWS APIs collection, we need to configure a few parameters here.

Select the Authorization tab, and change the Type from No Auth to API Key.

Change the Value to {{access_token}}, “Add to” has to be kept as Header.

Limiting routes through API calls with Postman

Create a new Collection for NSX API Calls

Here we are going to import an existing collection that has been created by my colleague Patrick Kremer here on  Github. By the way Patrick has also an excellent post here and even if it’s not covering the exact same use case it was a lot inspirational to me. I would like also to mention another excellent content from Gilles Chekroun.

Follow the same steps as before for the VMC collections this will add the following:

The two first are useful to check the configuration and the two others are used to implement things

Authenticating to VMC API

Now we can Login to the VMC on AWS API in order to execute the relevant command to create the Prefix Lists and do the Route filtering.

In order to do so, Select Login in the Authentication folder and Click the Send button on the right.

The body of the request shows a new access token which is valid for 1799 seconds.

Creating a Prefix List

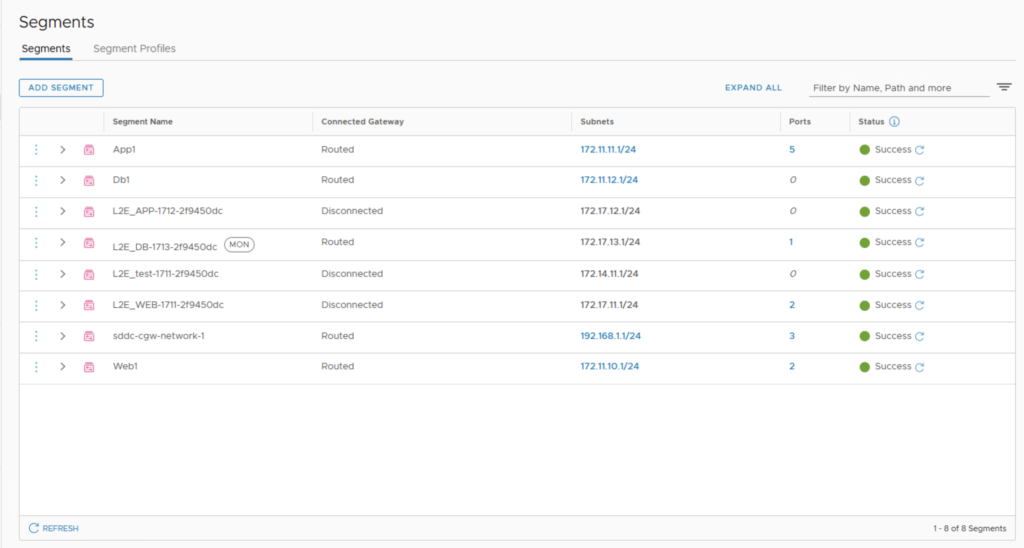
Now we need to create a prefix list in order to limit SDDC subnets to be advertised to the Transit Gateway through the BGP session of the route based VPN. Let’s say we want to limit the management subnet 10.73.118.0/23 to be accessible from the VPC. We also want to avoid that we can access the VPC (172.16.0.0/16) from the SDDC.

In order to achieve that we need to create two prefix lists, one to filter in and one to filter out.

From the Postman select Create Prefix List, give the prefix list ID a value.

I have chosen filter_mngt_subnet for the first Prefix List ID.

Next is to the body of the request.

{ "description": "This will filter the Management subnet from SDDC", "display_name": "{Filter out Management subnet}",
"id": "{{prefix-list-id}}",
"prefixes": [ { "action": "DENY", "network": "10.73.118.0/23" },
{ "action": "PERMIT", "network": "ANY" }
]}

Each prefix list need a DENY and a PERMIT ANY command to avoid blocking all traffic

Just click Send to add the Prefix List.

The result of the creation is a 200 OK.

I have created a second Prefix List in order to limit the VPC subnet from being advertised to the SDDC.

Display the Prefix Lists

Next step is to check the Prefix Lists has been created successfully by leveraging the Show BGP Prefix List command.

You should see the Prefix lists with all the already created ones.

Attaching the Prefix List to the route Filter

Now we have to attach the Prefix Lists to the BGP Neighbors configuration.

First of all grab the existing configuration by using the Show VMC T0 BGP Neighbors GET command.

The result is displayed as follow.

Copy this text and remove the following lines: _create_time, _create_user, _last_modified_time, _last_modified_user, _system_owned, _protection, _revision.

Now we are going to append the prefix Lists to the configuration by using the latest command: Attach Route Filter.

Grab the Neighbor ID from the result and paste it to the VALUE.

Copy and paste the previous result into the Body of the command and the prefix list command in an out.

Click the Send button.

Checking routes Filtering

If I check on the SDDC side I can see that the management subnet is now filtered out.

I confirmed it by checking on the AWS side in the Transit Gateway route table.

The management subnet is not displayed here

To conclude, I can also confirm that the VPC subnet is not advertised in the SDDC as I don’t see it as a learned route.

That concludes my post, enjoy filter out the routes!

Using VMWare Cloud DR to protect VMs in an SDDC. (Part 3 – Plan and Test DR)

In the previous post I have showed you how to create Protection Groups for my VMs. It’s now time to create the DR strategy and run a Test Failover and real Failover.

Planning the DR strategy

The DR strategy is enforced through the concept of DR Plan where we are going to help plan the different parameters that sustains the strategy including defining the protected resources, the orchestration order of the recovery process, and several additional options when the failover executes like changing the IP adresses or executes scripts.

Create a DR Plan

A DR plan defines the orchestration configuration for implementing the disaster recovery Strategy.

The following operations are allowed under the DR plan section:

  • Configuring DR Plans – require defining where you want your protected data moved to when the plan runs.
  • Viewing DR Plans – shows the currently defined plans along with plan summary information: the current status, protected and recovery sites, and the last run compliance check results.
  • Activating DR Plans – can be in an active or deactivated state.

In order to create a DR Plan, I need to click on Create plan from the DR plans Menu.

The List of already created DR plans appears.

Just give it a name and choose between using an existing recovery SDDC (Pilot Light) or make the SDDC deployed when a DR occurs.

In the next step, I have to select the source SDDC that is going to be my Protected site in this scenario.

I chose the Protection group I defined earlier.

Next steps are to map the different resources (datastores, folders, resource pools, virtual networks…) from the Protected to Recovery site.

It’s very important to map differences between the sites for smooth recovery, ensuring that vSphere configurations and parameters are mapped consistently between sites.

For folder, I have mapped my Workloads folders on both sites.

I kept the same mapping for the Resource pools and picked Compute-ResourcePool as this is where workloads are running in a SDDC.

For the segments, I have mapped the source segment to a different subnet in the recovery SDDC.

Keep in mind that Test and failover mappings can be different by unselecting the Same for test and failover button. Maybe you want to use a different subnet for testing (for instance an isolated one).

If you do a test, it will then follow the mapping setup in the Test mapping tab.

Next thing is the IP address mapping rules that’s helping to change the range of IPs, subnet masks and DNS settings at failover time. It does that by interacting with the VMTools in the VM while it’s running.

You can change the IP/mask/DGW/DNS address on a range basis or an Individual IP addresses basis.

Next thing is the ability to execute a script of any language for both Windows and Linux machine types from a script host. The script can be executed at a specified time from this script VM. The script VM need to be running in the Recovery SDDC and available from the vCenter of the recovery SDDC . You will call the script from the VM with any parameters you want to be running during the failover sequence.

To finish, the Recovery Steps will specify the order in which you want your VMs to be recovered.

There are different  options under the Recovery Steps.

  1. Choose a step which can be executed for either whole protection groups or an individual VM under the protection group.
  2. Select the Power action for recovered VMs.
  3. Select Pre-recover or Post-recover actions from the drop-down menu which can be running scripts which were saved under step 4 above.

For exemple, I chose to recover one VM first (could be a DB for instance), add a delay of 30 seconds, recover the remaining VMs (could be the remaining App VMs) and ask for a validation.

Lastly after you build the plan you can configure alerting.

Please note that vCDR uses the AWS mail service to send alerts. Recipients must respond to an email address verification Request before getting email from vCDR.

I did receive that email:

The validation occurred after I clicked on the link above:

Now it’s time to test the Plan and execute a failover.

Validating compliance of a DR Plan

In order to make sure the failover going to work, vCDR is performing a couple of compliance check. Continuous compliance checks verify the integrity of a DR plan and ensure that any changes in the failover environment do not invalidate a DR Plan’s directives when running.

Once a DR Plan is completed, the ongoing compliance checks runs every half an hour. It’s checking all the steps in the DR plan including the mappings, the source and destination environment availability and it keeps tracks of the mappings.

As I have opted in for it, at the end of the compliance check, I have received a Report by email with all the results of the checks.

The report shows a folder mapping that wasn’t including the VMs in my Protection Group so I did add the root folder in the mapping.

I forced a new compliance check by clicking the right arrows button.

There were still an error related to the proxy agent VM that vCDR automatically deployed in the SDDC.

Indeed there is a Cloud PRXY DR VM that have been created on my recovery SDDC as you can see.

This proxy VM is attached to a newly deployed network.

The created network is dedicated to the cloud DR proxy VM and it has the following subnet: 10.68.97.0/26.

Executing a Test

Every plan has the option to do a Test Failover or an actual Failover. The difference between a Failover and a Test is that a fail back will be required post a Failover where in a test you are just bringing a copy of your VM in the cloud and a fail back is not needed because you don’t want to overwrite the existing VMs on premise.

A failover means the production is down, so during a failover you actually take the VM to DR Site up and running. During a failover you will be ask which recovery point you want to pick.

A test failover runs in the context of its own test failover environment, specified by the DR plan’s test mapping rules. The results of the test failover do not permanently affect a target failover destination.

In order to test my plan, I just clicked on Test from the DR Plan menu.

The DR Test ask for which recovery Point within your catalog you want to pick.

You cab select any one of them in the entire protection Group. We can go back to any recovery point.

I have followed the wizard and first selected Ignore all errors.

With the Test, I had the option to run the VMs directly from the cloud backup which is the Cloud Filesytem sitting on top of S3 or to do a Full storage migration to the Recovery SDDC. The latest one means just after the VMs will be registered in the Cloud, they will be “storage vMotioned” from the SCFS into the vSAN Datastore of the SDDC. Obviously running the VM from the Cloud backup will not be as fast as all flash vSAN.

I kept Leave VMs and files in cloud backup for this test.

I confirmed that I wanted to kick off the test by writing TEST PLAN and clicked Run test.

After the test started, it has populated the VM in the Recovery SDDC.

So I have launched the Recovery SDDC vCenter from vCDR portal and could copy the credential as they are captured in it (very handy!).

I could see the my Two VMs in the Protection Group have been restored.

Once the test is over, you have to clean up the test by undoing the tasks, unregistering the VMs and revert back to initial state.

The clean up process is deleting the VMs from the SCFS as you can see.

The two VMs get unregistered from my vCenter.

Everything that have been done during my failover test is documented and is available through a pdf report where every steps is detailed.

I have generated it from the DR Plan Menu.

The Pdf report was autogenerated and downloaded in my local folder.

The report has multiple pages and is quite detailed as it includes the results of my test, the workflow steps, mappings and the time that it took per VM to come up, …

This is a great document to share with compliance people inside the organization.

That concludes my latest post of the year. Enjoy en of Year Celebration and see you next Year!

Using VMWare Cloud DR to protect VMs in an SDDC. (Part 2 – Protecting VMs)

In the first post of my series on Using vCDR to protect VMs in an existing SDDC, I have showed you how to configure an existing SDDC as a Protected Site.

Next thing to do is to start selecting the list of VMs running into the cloud that you want to protect with vCDR in a Recovery SDDC.

Protecting VMs running in the SDDC

It’s possible to protect VMs with vCDR by leveraging the concept of Protection group.

A Protection Group helps create a collection of VMs replicated to the cloud which can be then used as a group for recovery. You can create multiple groups of VMs through multiple Protection Groups.

Create a Protection group

Creating a Protection Group is very simple!

I have just clicked on the button Create protection group from my SDDC in the Protected sites menu.

I am then presented with a wizard to name the Protection Group, select my source SDDC vCenter and define Group membership.

In order to select the list of VMs, I have to create one vCenter query that defines the protection group’s dynamic membership.

A vCenter query is defined using:

  • VM Name pattern: a name pattern is a regex entry that supports wildcard and exclusion
  • VM Folder: a folder where my VMs run
  • VM Tags: vSphere Tags for quickly identifying the logical membership of VMs

The vCenter queries are evaluated each time a snapshot is taken and define the contents of the snapshot.

There is an option to use High-frequency snapshots. This option is really interesting as it brings RPO to as low as 30 minutes and allow for 48 snapshots a day.

There are a few caveats for enabling hfs such as vCenter and ESXi host version that must be updated to vSphere 7.0u2c+.

I was able to select it with the current version of my SDDC after launching a compatibility check.

I choose the following pattern for my VMs : *deb* in order to pick only my test Debian VMs.

I checked by clicking on the Preview VMs button.

It is important to mention that any additional VMs that are going to match that pattern will be automatically added to the group.

I can also do the same by selecting a VM folder.

Setting up a backup Policy

Once you have your VM selected, next step is to define a backup Policy with specific snapshot/replication schedule and retention time.

Snapshot schedule will define how frequently you want to take snapshots of the VMs defined in the group. You also define how long you want to retain those snapshots on the SCFS by selecting the right retention time.

I have been doing a lot of backup solution configuration in my past job as a EMC technical Consultant and I remember a few best practices that I wanted to share with you.

Forming a good Backup Strategy, you would implies

  1. Determine what data has to be backed up
  2. Determine how often data has to be backed up
  3. Test and Monitor your backup system

From the backup perspective and in order to fulfil common RPO needs, I have established the following schedule (it has to be adapted to workloads criticality):

  • 4 hours with 2 Days retention
  • Daily with 1 Week retention
  • Weekly with 4 Weeks retention
  • Monthly with 12 Months retention

The minimum replication (best RPO possible) is 30′ but here I didn’t choose this frequency. The more you replicate, the more you keep it in the cloud, the more capacity you would need on the cloud site for recovery perspective.

Important: Research indicates most victims of ransomware don’t discover that they have been compromised until an average of 3-6 months after the initial infection, so choose the retention period accordingly. 

Once you have defined your replication strategy and protection schedule for your group of Virtual Machines, the snapshots/replicas are going to start populated in the protection group.

I can click on any snapshots and see the VMs inside.

I have the option to restore any image of my VM back to on-premise. This an image level backup so this is going to overwrite the VM on-premise. So the VM has to be powered down before doing so.

Configuring a recovery SDDC

VCDR provides two deployment methods for recovery SDDC.

  • On-demand: also known as “just in time” deployment
  • Pilot Light: a small subset of SDDC hosts ready to take over the VMs in case of a DR for workload with lower RTO needs

For this post, I already have configured an SDDC in a different region and AZ for the purpose of recovering my test VMs.

As you can see there is a single host in it. It always possible to scale it up and add additional hosts in it. You can always create a single node SDDC for DR testing and then scale it up later.

You can also customize the recovery SDDC from here by adding new network segments, Compute Gateway FW rules, NAT rules or new Public IPs for instance.

To bring every thing together and finalize the DR Strategy, I need to create a DR Plan and test it.

I will cover that in the final post of my series.

Using VMWare Cloud DR to protect VMs in an SDDC. (Part 1 – Deploying vCDR)

VMware Cloud Disaster Recovery is currently the solution that has the most interest from my customers and partners. It’s a solution that offers the best way to deliver an on-demand easy-to-use cost effective DRaaS solution for workloads running on-premise.

A few months ago, it added the ability to protect cloud workloads running in VMware Cloud on AWS with inter-region DR failover (i.e. failover from one region to another region).

Very recently, the solution has now the ability to protect cloud workloads running in VMware Cloud on AWS with intra-region DR failover (i.e. failover into a different availability zone (AZ) within the same region).

Let’s see how we can leverage this to protect workloads.

Deploying vCDR in VMC on AWS

Accessing the vCDR dashboard

First of all I need to access the CSP Console and locate the VMWare Cloud DR tile under the My Service menu.

If I click on the tile here it brings me to VMware Cloud DR landing page.

As you can see it looks very similar to the CSP page. The development team have been doing a great job integrating vCDR in the Services portal.

Currently the dashboard is showing you the health capacity and especially the number of protected VMS, the number of Protection groups, as well as the replication direction of each of your protected sites and recovery SDDC.

In my current Demo environment, there are 3 protected on-premise sites and one recovery SDDC (CSLAB-M17).

Fan in architecture model is supported: 3 sites and 1 SDDC currently protected to CSLAB-M17

The cloud backup site where the Scalable Cloud Filesystem stands is CSA-VCDR-SCFS.

On the left, I can see the replication events and any recent alarms and alerts displayed.

Adding the SDDC as a new Protected site

In this lab, the Scalable Cloud File system has already been deployed. So we can directly jump into the deployment of the vCDR connector on my VMC on AWS SDDC by clicking the Set up a protected site link menu.

Here I choose VMware Cloud on AWS and Click Next.

The list of SDDCs in my organization are then displayed. I can see that only the SDDC that is in a different AZ from my SCFS can be used. So I picked the SDDC in US East North Virginia region.

Here I am presented with two choices: manually create the Gateway Firewall rules or leave vCDR automatically add the right rules. The DRaaS Connector is a VM that has to be deployed on a Compute segment in the SDDC. I decided to choose Automatic and pick the default segment of my SDDC. Obviously it’s up to you to choose another segment dedicated for it.

If you are not sure which option to select, see Network Considerations for a Protected SDDC for more information.

To finish the site creation I clicked Setup.

After a few seconds, the SDDC (JG-LAB-TEST) appears as a Protected Site.

Deploying the DRaaS Connector in the newly protected SDDC

Once the site is configured, the next step is to deploy the DRaaS connector which would enable the SaaS orchestrator communicate with the Protected SDDC vCenter. Refer to the Documentation for the VM CPU and network requirements

This process is quite straight forward. Just click on the Deploy button.

You will presented with a screen that explains every steps.

First of all you have to download the virtual appliance that will enable connectivity from the SDDC to the Cloud filesystem, second connect on the console to finish setting up the IP and to enter the Cloud orchestrator FQDN.

Make a note of the Console credentials, which you need to log in to the VM console: admin/vmware#1. Also copy (or write down) the Orchestrator Fully Qualified Domain Name (FQDN), which you need when you configure the connector in the VM console

A few things you need to know:

  • Do not name the DRaaS Connector VM using the same naming conventions you use to name VMs in your vSphere environment.
  • Avoid giving the DRaaS Connector VM a name that might match the VM name pattern you use when you define protection groups.
  • If you are deploying the DRaaS Connector to a VMware Cloud SDDC with more than one cluster, you must choose a cluster to deploy the connector VM on. Each cluster in your SDDC must have the connector VM deployed on it in order for the VMs running on the cluster to be added to protection groups and replicated to a cloud backup site.
  • Do not use non-ASCII characters for the connector name label.

After downloading the OVA by using the URL, I have uploaded the OVA to a Content Library in my SDDC. And started the deployment of the OVA.

I gave it a name.

The only Resource pool that I can choose is the Compute-ResourcePool.

The Storage datastore can only be WorkloadDatastore.

I have chosen the default compute segment (sddc-cgw-network-1).

I am then presented with the final page of the wizard and I click finish to launch the deployment.

After a few seconds, the Connector Virtual Machine appears in the inventory. I just started the VM to be able to continue the setup.

Finishing configuring the Cloud Connector in the SDDC

Second phase of the deployment is to setting up the networking.

Once the VM has started, I have had to open a console from vCenter in order to finish the configuration I have had to connect with credential presented is the latest window: admin/vmware#1.

I have typed ‘a’ to start Static IP allocation and entered a new IP address and subnet mask plus a DNS IP address (I picked the google one).

Next step is to enter the Cloud Orchestrator FQDN.

And to achieve the configuration the site specific pass-code…

and the site label (I kept the same name as the VM).

After a few seconds, I received a Success message to inform me that the setup was achieved.

To finish this phase, I have checked that the right firewall rules have been created in my SDDC.

With the newly added rule, the segment where the Cloud Connector runs has access to the Cloud Orchestrator in the cloud with SSH and HTTPS, to the SDDC vCenter, and to the Auto-support server in HTTPS. Finally it has also access to the scalable Cloud File System on the port TCP 1759.

That’s conclude the first part of this very long series of post on vCDR.

In my next post I am going to show you how to start protecting VMs in the Protected SDDC!

NSX Manager Standalone UI for VMC on AWS

Today I want to focus on the new feature from M16 release that enable customer to have a direct access to NSX Manager UI.

This is for me an interesting capability especially because it gives access to a more familiar interface (at least for customers that already utilise NSX-T) and it also reduces the latency involved with the CSP Portal reverse proxy.

In addition, it enables the access to NSX-T TraceFlow which will be very helpful to investigate connectivity issues.

Let’s have a look at this new Standalone UI mode.

Accessing the standalone UI

There are two ways to access the NSX Manager Standalone UI in VMC on AWS:

  • Via Internet through the reverse proxy IP address of NSX Manager. No particular rule is needed on the MGW.
  • Via the private IP of NSX Manager. It’s the option you will take if you have configured a VPN or a Direct Connect. A MGW firewall rule is needed in that case.

In order to choose between the type of access that fits our needs, we need to select it in the Settings tab of the VMC on AWS CSP console.

There are two ways to authenticate to the UI when leveraging the Private IP:

  • Log in through VMware Cloud Services: log in to NSX manager using your VMware Cloud on AWS credentials
  • Log in through NSX Manager credentials: log in using the credentials of the NSX Manager Admin User Account (to perform all tasks related to deployment and administration of NSX) or the NSX Manager Audit User Account (to view NSX service settings and events)

Both accounts have already been created in the backend and their user name and password are accessible below the URLs.

I have chosen the Private IP as I have established a VPN to my test SDDC.

So prior to accessing the NSX Manager, I have had to create a Management Gateway Firewall rule to allow source networks in my lab to access NSX Manager on HTTPS (the predefined group NSX Manager is used as a target).

Navigating the standalone UI

I started by clicking on the first URL here:

After a few seconds, I am presented with the NSX Manager UI:

Networking tab

Menu from Networking Tab

This tab will give you access to configuring the Connectivity options, Network Services, Cloud Services, IP Management, or Settings.

Basically the settings can be accessed in read only or read/write mode.

Keep in mind you will not have more rights or permissions to modify settings than if you were editing it from the CSP Console.

VPN and NAT options are accessible with same capabilities as from CSP console.

The Load Balancing options is there and is usable only if you have Tanzu activated in your cluster.

For example, for the Direct Connect you can change the ASN number or enable VPN as a backup.

For Transit Connect, you can have a look at the list of Routes Learned or Advertised.

Public IPs allow for requesting new IP addresses for using them with HCX or a NAT rule.

Let see what’s possible to do from the Segments menu.

From here you can see is a list of all your segments. You can also create a new segment, modify an existing segments or delete your segments.

I was able to edit the settings of one of my segment DHCP configuration.

I was also able to edit my Policy Based VPN settings.

All the other options are reflecting what we can already do in the CSP Console.

Security tab

This Menu is divided into two parts:

  • East-West Security that gives access to the Distributed Firewall rules and Distributed IDS/IPS configuration,
  • North-South Security covers internal traffic protection and the Gateway Firewall rules settings.

Nothing really interesting here, it’s pretty much the same as from the CSP Console as you can see here:

On the Distributed IDS/IPS, I can review the results of my previous penetration testing that I did in my previous post.

Inventory tab

This tab is covering:

  • Services: this where you’ll configure new protocol and services you want to leverage in the FW rules
  • Groups: group of Virtual Machines for Management FW rules and Compute Gateway rules
  • Context Profiles: you can basically add new FQDNs useful for the DFW FQDN filtering feature, AppIDs for Context Aware Firewall rule, and set up Context Profiles.
  • Virtual Machines: list all the VMs running an attached to segments with their status (Stopped, Running, …)
  • Containers: will show Namespaces and Tanzu Clusters.

Plan and Troubleshoot tab

The tab is covering:

  • IPFIX: this where you’ll configure new protocol and services you want to leverage in the FW rules
  • Port Mirroring: this permits to setup a target collector VM and then replicate and redirect all trafic from a logical port switch to it for analysis purpose
  • Traceflow: very nice feature to monitor and trouble shoot a trafic flow between two VMs and to analyze the path of the trafic flow.

The last one is a feature not existing on the current VMC on AWS CSP Console and which is to my opinion worth having a look at.

Traceflow option

Let’s have a look more deeply into what this brings onto the table in my next post.

Stay tune!

NSX Advanced Firewall Add On for VMware Cloud on AWS (Part 3)

In my previous post, I talked about the FQDN filtering feature which is one of the new Add-Ons of the Advanced firewall.

In this Part 3 of this multi part blog series, let’s focus on the latest feature, the Distributed IDS/IPS which is part of the newly announced NSX Advanced Firewall for VMware Cloud on AWS.

Introduction to Distributed IPS/IDS

With NSX Distributed IDS/ IPS, customers gain protection against attempts to exploit vulnerabilities in workloads running on VMware Cloud on AWS.

Distributed IDS/ IPS is an application-aware deep packet inspection engine that can examine and protect traffic inside the SDDC. Customers can detect and prevent lateral threat movement within the SDDC using the intrinsic security capabilities of Distributed IDS/IPS. 

Like DFW, Distributed IDS/IPS is built into the hypervisor and inspection can be performed for all traffic coming into or leaving the VM. Since the inspection is performed on all the hypervisor hosts in a distributed manner, there is no single inspection bottleneck that chokes the traffic flow.

Enabling Distributed IDS/IPS

First thing we will do is to activate and configure the Distributed IDS/IPS feature in VMC on AWS SDDC.

If you don’t have already activated the NSX Advanced Firewall add-on, please do so otherwise you will get this message:

Remember in my first Post of this series, I already have shown you how to activate the NSX Advanced Firewall Add On for VMware Cloud on AWS.

Once you have activated the add-on feature, in the browser, Click the Networking and Security tab. Click Distributed IDS/IPS, located in the Security Section.

The IDS/IPS is disabled by default so you have to enable it for the cluster. Here I have only one cluster.

Just move the slider to enable the feature and confirm that you want to enable the cluster and you are ready to test it!

Once it’s enabled you can choose to regularly update the Signatures by selecting the Auto Update new versions button.

NSX Distributed IDS/IPS utilizes the latest threat signature sets and anomaly detection algorithms to identify attempts at exploiting vulnerabilities in applications. It is integrated with the NSX Threat Intelligence Cloud Service to always remain up to date on the latest threats identified on the Internet.

You can check the other versions that have been presents in the environment by clicking the View and change versions link.

This is launching a new window with historical details. Here we can see that the first Default Signature was installed Jun 17th, 2021 and additional signatures has been pushed Oct 20th and Nov 12nd.

By clicking on the New signatures, I can dive deep into the details of each of them and access really good information on what signatures have been disabled, updated, …

We are gonna go ahead and be using the latest versions.

If you don’t have access to Internet from your NSX Manager, you also download the IDS/IPS signatures from the Network Threat Intelligence services page and be able to upload them manually.

Now it’s time to finish configuring the feature and launch some real test attacks by leveraging both Kali Linux and the infection Monkey tooling to simulate some attacks!

Configuring Distributed IDS/IPS profile & rule

Create a Profile for IDS/IPS

In this section, I will create a default profile to use with an IDS/IPS rule.

NB: We can configure up to 25 profiles.

Under the Profiles tab under Distributed IDS/IPS within the Security section, I have clicked ADD PROFILE and create the ChrisIDSProfile profile:

I have accepted the default settings but you can customise the profile to meet your requirements. You can for instance only select the Intrusion attack with a level of severity to Critical or High and Critical only.

One thing you can do is to tweak it by selecting specific CVSS or Attack types.

I clicked save to finish creating the Profile.

We can see that the profile has been successfully created.

After a few seconds it appears in green:

Create a Policy with rules for IDS/IPS

Now let’s create a Policy.

For that, I need to go to the Rules tab and add a specific IDS/IPS Policy called ChrisIDS-Policy.

I have selected the check box next to the name of the policy, then click Add Rule.

To finish the configuration I have to select the profile previously created.

I have also changed the source from Any to my SDDC subnets.

Please note that I leave the Sources and Services columns to Any and the Applied to field set to DFW.

I have also left the Mode to Detect Only. In Production it’s better to change this setting and switch to Detect & Prevent.

Now that I am done with the setup, I just need to click Publish.

Now it’s time to go for some tests of attacks and exploits.

Testing the IDS/IPS

In order to test the IDS/IPS feature, I have used my best security scanning tools to generate some attacks and try to exploit some vulnerabilities in one special server.

Basically I will launch the exploits on a OWASP Web Application server which is a test server with vulnerabilities that I have deployed in my SDDC. In a nutshell OWASP stands for The Open Web Application Security Project® and it is a nonprofit foundation that works to improve the security of software. It’s a very good way to test the level of security of your environment.

This OWASP server is going to be the target for all the vulnerability scanning coming from my two different tools.

Scanning tools

First one is the Kali Linux distribution in a Virtual Machine which have a multitude of security tools preinstalled in it. I love it!

The second one is the Infection Monkey virtual appliance from Guardicore which is a platform with a graphical interface that you can leverage to launch the exploits.

Infection Monkey is an open source breach and attack simulation (BAS) platform that allows organisations to discover security gaps and fix them. You can Simply infect a random machine with the Infection Monkey and automatically discover your security risks. Test for different scenarios – credential theft, compromised machines and other security flaws.

Deploying Kali Linux

It’s a simple process as you can install it from a ISO CD or download a virtual image directly from here.

I have choose to install it with the ISO CD as it gives more flexibility to tweak your VM settings.

Once the VM is deployed there is nothing more to do.

Deploying Monkey Island VM

First I have deployed the Monkey Island VM from the OVA downloaded from the Infection Monkey website. This is an Ubuntu Linux VM with a small footprint of only 2 vCPU and 2GB of RAM.

Once it’s been installed, I have just started the VM.

My VM is up and running very quickly and I can connect to it from the web console on port 5000:

Once I am logged in with the default username: monkeyuser and password, I can setup the system.

I start by clicking on Configure Monkey.

I need to click the Network tab, and Change the Target list IP address with the IP address of the OWASP VM running in the App segment (172.11.11.115).

Then I clicked on the Run Monkey on the left and Select From Island.

At that moment the tool launches the exploits automatically.

Launching the attacks and exploits

With Kali Linux tools

In my environment, the Kali Linux server address is 172.11.11.107.

And the OWASP Broken Web Application has the following address: 172.11.11.115.

In this first stage, I started to use Kali Linux with nmap to scan the OWASP Web server.

As you can see, there are 9 opened ports on the machine. The nmap command is able to output the name and version of the services that use the ports

Is this next step, I have leveraged the nikto command to scan for vulnerabilities on the server.

Multiple vulnerabilities have been displayed. Mainly affecting the Apache server and also the version of Python which is outdated

The result of the exploit is visible now on the CSP Console as you can see on the screen below. At the top, you can see there is representation of the attempt to compromise the server and they are spread over a time range with a slider that can be changed as needed.

The attacks have triggered a lot of Emerging Threats (ET Scan) alerts with Medium, High and Critical severity levels.

Medium alerts inform that the http protocol on the Web-Server is exploitable with vulnerabilities. The response here is just “Detect”. You can see the CVE number and CVSS Classification of the vulnerabilities on the right.

When I click on the VMs Affected, a list of the VM that have been affected by the vulnerabilities displays:

In addition, clicking the purple bar allow for displaying a detail window:

With Monkey Island tools

As I said before the scanner starts automatically after finishing the setup. Once it has finished its scanning operations, Monkey Island shows a map with all the results accessible through a web page.

It also displays a map of the devices that have been scanned by the tool.

On the right of the page, there is a tab called ATT&CK report that helps understand the exploits that have successfully been used or tried.

On the VMC on AWS Console, the results are displayed the same way as before with the Kali Linux tool:

The Alert displayed here is an apache Struts remote code execution attempt.

Conclusion

This new Advanced Firewall Add-on IDS/IPS feature is really interesting as today it’s the only way to prevent attacker from exploiting vulnerabilities from inside the SDDC.

That’s conclude the post, I hope this has given you a better understanding on how this feature is powerful.

NSX Advanced Firewall Add On for VMware Cloud on AWS (Part 2)

In my previous post, I have introduced you to the new Advanced Firewall Add-on in VMWare Cloud on AWS.

I also covered the Context Aware Firewall feature to filter connection based on the App id and not only the protocol number.

In this post, I am going to cover Distributed FW FQDN filtering to allow applications that communicate outside the SDDC gain layer 7 protection.

Introducing the FQDN Filtering feature

This feature can allow users to only access specific domains by whitelisting and/or blacklisting FQDNs. In many high-security environments, outgoing traffic is filtered using the Distributed firewall. When you want to access an external service, you usually create IP-based firewall rules. In some cases, you don’t know which IP addresses hide behind a domain. This is where domain filters come in handy.

Because NSX-T Data Center uses DNS Snooping to obtain a mapping between the IP address and the FQDN, you must set up a DNS rule first, and then the FQDN allowlist or denylist rule below it.

SpoofGuard should be enabled across the switch on all logical ports to protect against the risk of DNS spoofing attacks. A DNS spoofing attack is when a malicious VM can inject spoofed DNS responses to redirect traffic to malicious endpoints or bypass the firewall

You can define specific FQDNs that are allowed and apply them to DFW policies. Conversely, you can define specific FQDNs that are denied access to applications in the SDDC. The DFW maintains the context of VMs when they migrate. You can then increasingly rely on application profiling and FQDN filtering to reduce the attack surface of their applications to designated protocols and destinations.

Configuring DFW with FQDN filtering

In this section, I will show you how to setup a FQDN Context Profile, and a Firewall policy to limit access to specific URLs from VMs.

Creating a FQDN Context Profile.

First thing first ! Let’s create the context Profile.

Under Networking and Security, in the Inventory section, click Context Profile.

Click FQDNs Tab

Click ACTIONS –> Add FQDN

Enter the Domain: *.yahoo.com, and then Click SAVE.

Create a second FQDN with *.google.com.

Click the Context Profile Tab, and Click ADD CONTEXT PROFILE

Give it a Name: Allowed FQDNs, Click Set

Click ADD ATTRIBUTE –> Domain(FQDN) Name

Select the following domains: *.yahoo.com, *.office.com, *.google.com and Click ADD.

Click APPLY, Click SAVE. We now have a Context Profile setup.

Creating a Firewall rule and a Policy

I have created a Group called MyDesktops which includes a segment with my Windows VMs.

Now I am going to setup a Firewall Policy including this Context Profile. I will limit my VM in the MyDesktops group to access to the Allowed FQDNs. Also I limit access from this Group of VMs to specific DNS servers (8.8.8.8, 8.8.4.4).

I also add a Drop rule at the end to limit access to only the FQDNs that were whitelisted.

Now I am allowed to access google.com and Yahoo.com but I can’t connect anymore to the vmware.com site.

This concludes the post on FQDN Filtering. In my final post, I will cover the Distributed IDS/IPS feature.

NSX Advanced Firewall Add On for VMware Cloud on AWS (Part 1)

VMware Cloud on AWS already offers a robust sets of networking and security capabilities that enable customers to run production applications securely in the cloud.

The release of the M16 version is introducing new Advanced Firewall Features as an Add-on.

This includes the following new security capabilities:

  • L7 Distributed (Context Aware) Firewall with application ID – With L7 (Context-aware) firewall you can go beyond simple IP/ port level layer 4 security to complete stateful layer 7 controls and filtering.
  • L7 Distributed Firewall with FQDN Filtering – Applications that communicate outside the SDDC also gain layer 7 protection using Distributed Firewall FQDN filtering capability. Customers can define specific FQDNs you can define specific FQDNs that are denied access to applications in the SDDC. The DFW maintains the context of VMs when they migrate. Customers increasingly rely on application profiling and FQDN filtering to reduce the attack surface of their applications to designated protocols and destinations.
  • User Identity Firewall – You can create groups based on User ID and define DFW rules to control access to virtual desktops and applications in the SDDC. Per user/ user session access control limits the amount of time and exposure users have to desktops or applications. Integration with Active Directory / LDAP enables the DFW to continuously curate user access to applications. User ID based rules are enforced by the DFW at the source, delivering pervasive, intrinsic security throughout the SDDC.
  • Distributed IDS/IPS – With NSX Distributed IDS/ IPS, customers gain protection against attempts to exploit vulnerabilities in workloads on VMware Cloud on AWS. Distributed IDS/ IPS is an application-aware deep packet inspection engine that can examine and protect traffic inside the SDDC.

Let’s try them to see how it works!

Enabling the NSX Advanced Firewall Add-On

The NSX Advanced Firewall Add-on adds Layer-7 Firewall protection, Identity Firewalling, Distributed IDS/IPS and FQDN Filtering to the VMC on AWS SDDC. This Feature is an Add-on featured and priced in addition to the Standard VMC on AWS subscription.

Before any of these features can be used, you must first enable the add-on onto your SDDC. In the following section, I am going to walk you through the steps of enabling the NSX Advanced Firewall functionality onto your SDDC.

  1. On your SDDC tile, click View Details
  2. Click the Add-Ons tab
  3. In the NSX Advanced Firewall Tile, click Activate

Click Activate

Click OPEN NSX ADVANCED FIREWALL (This will take you to the Networking & Security Tab)

At this step, the NSX Advanced Firewall Addon has been enabled. To make use of the functionality it provides, you must configure them individually.

In the upcoming sections, we will configure and test each of these features.

Configuring L7 Distributed Context Aware Firewall

With L7 (Context-aware) firewall, it’s possible to go beyond simple IP/ port level layer 4 security to complete stateful layer 7 controls and filtering. This will avoid for instance someone from changing Port number to bypass a firewall rule.

Extremely powerful !

Deep packet inspection (DPI) built into the Distributed Firewall enables you to allow only the intended application / protocols to run, while denying all other traffic at the source. This enables you to isolate sensitive applications by creating virtual zones within the SDDC.

Distributed Firewall (DFW) layer 7 policies are enforced at the hypervisor (vNIC) level and can migrate with the VM when they move from host to host in the SDDC, ensuring there are no gaps in enforcement.

Let’s see how to configure and use the feature.

Configuring a standard L4 FW rule

In my example, I have two VMs (webserver01, webserver02) running in my SDDC which are part of a group called Web Tier.

Here are the IPs of the VMS:

They can communicate together over any protocol as this is the default settings in the Distributed Firewall as we can see here:

First let’s create a traditional L4 firewall rule to block SSH traffic between the two VMS.

Now if I want to ssh from webserver01 to webserver02 it’s blocked:

What if SSH was listening on another port, however? What if some nefarious person (knowing SSH on port 22 is being blocked) changed the port the server listens on and attempts to SSH to the server against this new port, what happens then? 

To do that I have edited the sshd_config on the webserver02 VM and changed the port to 2222:

I have then restarted the ssh service on the VM:

We can see the ssh server is now running on port 2222:

Let see what happens when we apply context awareness to the firewall rule.

now if I try to connect back but on port 2222, it works!

Unfortunately, the L4 DFW doesn’t block it. As mentioned earlier the firewall is looking for SSH on port 22, not port 2222, so I was able to bypass the firewall policy.

Configuring Context Aware Firewall rule

NSX Context-Aware Firewall  Rule (L7) enhances visibility at the application level and helps to override the problem of application permeability. Visibility at the application layer helps you to monitor the workloads better from a resource, compliance, and security point of view.

In order to switch to the Context Aware firewall, I just have to remove the SSH in the Service field from the DFW rule and need to add SSH in the Context Profile field:

The rule is now changed:

Let’s try to connect again to port 2222:

Now the attempt to connect to the modified port is block. That’s much better! This is because the DFW now assesses the packet at layer 7 and identifies the heuristics of the packet to be ssh and does not allow the traffic through.

With Context-Aware Firewalling you can enable enforcement of security protocol versions/ciphers reduce attacks by only allowing traffic matching APP Fingerprint, and enforce port-independent rules.

In the next post I will introduce you to the L7 Distributed Firewall with FQDN Filtering. Stay tune!

Leveraging Log Insight Cloud for VMC logging and auditing

In this blog post I will talk about how vRealize Log Insight Cloud can be leveraged to monitor the Audit logs of Vmware Cloud on AWS.

Introduction to vRLIC

vRealize Log IC is able to ingest data coming from multiple sources including Physical infrastructure, VMware Cloud on AWS as well as Cloud providers platform or applications running on any cloud. It gives customers the choice on multiple ingestion options like :

  • Remote Cloud proxy: a small virtual appliance deployed on-premise to collect data from any physical or virtual on-premises hardware as well when redirecting logs from vRLIC to an external SIEM (like Splunk)
  • VMC integration: any subscribed customer will get audit and security logs automatically redirected to a cloud instance of vRLIC unlike the NSX-T firewall logs that need to be activated
  • REST API integration: allow to push logs from any log agent like Fluentd or Logstash running on applications running anywhere but can also use the vRLI agent and Cloud proxy
  • Cloud native AWS, GCP or Azure integration: for instance AWS CloudWatch or Cloudtrails logs can be redirected to vRLIC through a lambda function. Azure or GCP can send several log types through HTTPs.

There is nothing to configure with VMC on AWS and once customers gets access to vRealize Log Insight cloud, they are automatically getting all the audit and firewall logs coming from VMC.

The Cloud Proxy

The Cloud proxy is basically responsible for sending logs coming from on-prem to the vRealize Log Insight Cloud.

It can be installed from the vRLIC instance by going to the Cloud Proxies available under the Configuration Menu.

Once you click you will be redirected to a pop window with a link to directly download the proxy OVA. A specific key is also generated and it will have to be used when you deploy the OVA on-premise in order to identify it towards the vRLIC instance.

Content Packs

vRealize Log insight Cloud leverage the concept of Content Packs to add additional dashboards and alerts settings preconfigured to enrich the default configuration.

Content packs are a bundling of dashboards, queries, alerts, and extracted fields to make it easier to consume log data coming from your applications and infrastructure. vRealize Log Insight Cloud offers content packs for VMware products such as VMware Cloud on AWS, NSX-T, NSX-V, vSphere, vSAN, vRealize Operations, vRealize Network Insight, and Workspace One just to name a few.

There are content packs for infrastructure like firewalls and switches, and applications such as Apache, MySQL, SQL Server, and Active Directory.

There are also a content pack for popular AWS Cloud Services such as S3 and RDS. I will cover this topic in a next post. We have added recently support for Azure And Google Cloud as well.

There are currently around 77 Content Packs available in vRealize Log insight cloud today which makes it a very relevant platform when it comes to monitor Cloud native applications, virtual infrastructure, as well as on-premise computing and networking devices.

Log Sources

There are a lot of different log sources ranging from infrastructure, applications, development tools, middleware, AWS, Azure, GCP.

The first thing you do when you want to add a new log sources is to verify the steps to add the log source. In order to do it just go to the Log Sources page of vRLIC here:

and select the relevant solutions you want to collect logs from.

Let’s say you want to add AWS CloudTrail logs into Log Insight Cloud. What you need to do is just select the CloudTrail Log sources and you will be guided by the configuration guide listing all the required steps. Very easy!

Out of the Box content for VMC on AWS

There are a lot of interesting content that customers are entitled to when subscribing to the VMC on AWS service including VMC on AWS specific Dashboards, Queries and Alerts.

The following 3 Content Packs are enabled by default and they can be consumed as soon as logs are starting flowing into vRLIC.

As for now the latest versions of the Content Packs are :

  • 4.4 for the General
  • 2.0 for the Audit Events for VMware Cloud on AWS
  • 4.0 for the NSX-T for VMware Cloud on AWS

In the free edition, customer will not be able to activate any other Content Packs.

What logging content comes with VMware Cloud?

When the customer subscribe to the VMC on AWS service the following content are enabled by default :

  • Audit Logs: is a Core service for VMC customers that monitors VMC deployments for potential security breaches or internal misuses of infrastructure as well as give visibility into VMC deployment, including which users is doing what and when, which users created or deleted a VM or accessed the CSP portal,
  • Firewall Logs: allow to gain visibility on the NSX-T Firewall or DFW events and monitor traffic being allowed or dropped. This mainly helps customers to tune the firewall security policies and monitor the dropped packets or the traffic flow that is needed for security.

Please note that the Firewall Logs are only available in the paid version.

Be aware that as a customer, you will not have access to all the messages coming from VMC on AWS like you would from your on-premise infrastructure. We have agreement with AWS that we won’t be exposing any of the underlying hardware and infrastructure to customers.

But don’t worry ! That’s not really of a problem as VMC on AWS is a managed service where VMware is taking care of the infrastructure including the hosts and the clusters. So we do have SREs in the back end that have access to the logs to make sure everything is ok.

What are the AUDIT logs for VMC?

Basically what is collected as log messages is well documented by VMware through the specific filters that are applied at VMC level and it can be checked from the documentation here.

It includes the raw log messages coming from ESXi, vCenter, and User-driven Activity Events as well as the NSX-T Audit and Packet Log Events. We also redirected all the VMC Notification Gateway Events.

Audit Events

The Audit Events for VMware Cloud on AWS Content Pack comes with 11 dashboards.

The Activity dashboard is all related to activity logs from VMC and it includes the major changes made to your SDDC classified by Type, by User or by Resource Type.

The one I found the most interesting is the VMC Overview dashboard as it gives a unique view on the multiple Events that affect the SDDC and the Alarms that have been triggered.

This is where you can list the number of VM created and deleted for instance.

In the Dashboard workbench, you can edit the dashboard and adapt the visualisation to your needs.

Editing a widget into a dashboard allow for modifying the look and feel and to switch from multiple visualisation and different colors.

You can also remove or add widgets by dragging and dropping a widget from the left to the right.

Once you have modified the dashboards, you can save it to a new name.

Be aware that Content pack dashboard are read only and need to be cloned prior to editing.

NSX-T events

The NSX-T Content Pack comes with 5 dashboards covering Distributed FW events (overview and traffic), Gateway Firewall log messages, NSX-T Audit events and a specific one for DHCP events.

It covers all the major changes made to the Gateway and distributed Firewall inside the SDDC.

Here is an example of the type of logs you can get from the Distributed Firewall – Traffic dashboard including the traffic traversing the FW including Sources or Application Ports Permitted:

or also FW Destinations:

Exploring Logs for VMC on AWS

Log explorer is where you can see the log stream, log types and alerts. This is where you can filter based on specific criteria and view the details of the log messages as well as create queries for custom dashboards and alerts.

You can also extract fields from the log explorer view. The Log Explorer is gonna show on the right hand side the fields which are the string of text that are in the log message.

Extracted fields are really powerful as they can be leverage in the ADD filters to help you filter log messages based on a particular value. That could be for example to see logs for a particular host or an application.

In order to access the Log Explorer, you just have to Select Explore Logs from the drop down menu on the left to access it.

If you don’t filter on anything all the log messages coming from all the hosts will be displayed.

There are different ways to view messages by leveraging several filtering options. Common language search is supported and you don’t have to be an expert in regular expression (REGEX is also supported however).

Whenever you create a query by using a query filter you can create an alert from it and get an email notification when a particular log message is detected.

Once you have created your queries you can favorite, save, compare and pin them and come back later to the specific queries that you have saved.

All VMware Cloud on AWS Logs will have an associated SDDC_ID. If multiple SDDC’s exist, each will have a unique ID. So you can limit the view to a specific SDDC by entering the SDDC ID as a filter for example.

The time frame is by default 5 minutes and it must sometimes be updated to reflect older log messages and avoid empty dashboards. You can specify a custom Time Range if you want to filter on a larger time frame like multiple hours, days or months. Even when increasing the time window some widgets will remain empty and that is completely normal in a healthy configuration.

There are different ways to view messages:

  • Event Types display the most frequently occurring events
  • Alerts is specifically focusing on the alerts present in log messages
  • Event Trends is there to help you better understand the trends in the environment.

So you have the option to view log messages by Event Types and limit the view to Alerts present in the log message.

Event Trends is delivering the information on the frequency (event per hour) on specific Events. This is doing a log comparison again the user defined window (time frame) by grouping log messages into categories. This is leveraging an AI driven log categorization to group related log messages into log types.

To access the information on the event frequency, just go over the related events as displayed bellow:

Enabling SDDC alerts

Some thing to call out is that by default none of the VMC Alerts that are coming from the VMC Content Packs are enabled.

In order to enable some of the main Alerts for VMC, you first need to switch to the Alert definitions Menu and toggle the switch on the left that it appears in green.

You can always disable an alert for a certain amount fo time if you will.

There is also a Triggered Alerts area where you can view the Alerts that were triggered over a specific time and it is represented through a Graph on which you can adjust the Time Frame.

You can also view the details of the Alerts in a log explorer at the bottom of the window like here:

and you can also update an Alert definition if you have created it.

Adding Notification to an Alert

Once you have activated an Alert you might want to change the notification options and add specific emails, webhooks like slack channels as recipient.

There are several other attributes that you can update in the Alerts settings, here are a list of them:

  • Query: what is the search criteria for generating the alert
  • Trigger Conditions and Severity
  • Notify: this is where you will choose the specific method to get the notification event it can be Email, or a Webhook (Slack, PagerDuty,Datadog)
  • Metadata: key value pair to be sent as payload to the webhook
  • Tags: add a tag to an alert to easily search for same type of Alerts

Please note that you can only add tags, or add metadata, or change the notification recipient in the Content Pack Alerts.

Conclusion

vRLIC is really a valuable product for DAY 2 operations in VMC on AWS. In my next posts I will show you some examples on how we can leverage the logging and alerting features of the product.

Stay tune!

HCX MON Policy routes

I recently have had a question from a customer asking me how the default route is managed into HCX when Mobility Optimized Network is enabled.

Basically when extending multiple VLANS from on-premise to VMware Cloud on AWS by leveraging HCX, you may still want to send egress traffic to an on-premise security device in order for the workloads running in the SDDC to be protected.

I decided to check the way HCX is managing default gateway in my own on-premise lab.

Testing the default gateway with MON

I have a VMware vSphere lab environment with a 3 nodes VSAN cluster which is link via Internet to an SDDC that I have deployed with Terraform on our internal CSA Organisation. I have already established site pairing between both sites:

And created a service mesh:

Then I have extended 3 networks to the VMware Cloud on AWS SDDC: APP (VLAN 1712), DB (VLAN 1713) and WEB (VLAN 1711).

Two extended networks are MON enabled: APP and WEB.

On the APP network (VLAN 1712), I have deployed one VM (DEB10-APP01) which is running in my VSAN on-premise 3 nodes cluster. This network Extension hasn’t MON feature enabled.

I have also setup a second subnet called WEB(VLAN 1711). I have another VM (DEB10-WEB01) running there, which have been migrated on a new cluster in VMware Cloud on AWS. This extended network is MON enabled.

I have open a shell session and try to ping the on premise VM DEB10-APP01 from DEB10-WEB01. The trafic is flowing over the internet to my on-premise site through the service mesh:

This is a ping between my VM in SDDC (WEB, 172.11.11.105) to on-premise VM (172.11.12.107, APP)

Now I wanted to check where the default route is in the SDDC. Is it going to be the IGW through the T0 router or is it going to be the on-premise gateway?

To check, I have traceroute to the 8.8.8.8.

This is not using my on-premise gateway to egress traffic. However default traffic is going out through the T0 router and internet gateway of the SDDC in AWS.

So now how can I make traffic on a MON enabled network to egress via on-premises?

How the HCX MON Policy routing works?

How HCX MON Policy routing works is very simple. When MON is enabled on a network extended segment, HCX adds the gateway IP with /32 net mask into the SDDC Compute Gateway. For each VM that has MON enabled there is also a /32 route injection for created or Migrated Virtual Machines. So whenever a Virtual machine on the different segment in the SDDC wants to reach the VM it will allow reachability from SDDC Compute Gateway.

There is a default setting in the Policy routing that is evaluated whenever a destination is not within the SDDC:

If the destination IP is matched in the policy and allowed by the policy, the trafic is forwarded to the on-premise gateway. If the destination IP is not listed in the policy settings then the traffic is sent to the T0 router in the SDDC and routed accordingly.

Changing the HCX MON Policy routes

This setting can however be changed by editing it through a menu available from the ADVANCED tab in the console:

The default MON Policy setting is, as displayed, allowing only RFC-1918 subnets to be routed back to on-premise gateway :

Only private subnet traffic is forwarded to the on-premise router. Internet egress is sent to the SDDC Compute Gateway.

To change the default policy routing to route default egress traffic to on-premise, you simply have to add a 0.0.0.0/0 route in the list as allowed.

The default route is now displayed in the policy Routes setting:

Default route means that Internet traffic will flow over the Interconnect from SDDC to the on-premise gateway.

Let’s check it by launching a traceroute again from my VM in the SDDC:

It shows now that the traffic is sent to my on-premise default gateway (192.168.2.1).

Conclusion

When you have MON enabled with the default route policy settings and you are advertising 0.0.0.0/0 into the SDDC, HCX ignore this and still send traffic out of the IGW.

Whenever you advertised the default route to the SDDC through BGP, you must change the default Policy to avoid egress traffic to be sent to the Tier-0 router, otherwise you will experience asymmetric routing.