Using VMWare Cloud DR to protect VMs in an SDDC. (Part 3 – Plan and Test DR)

In the previous post I have showed you how to create Protection Groups for my VMs. It’s now time to create the DR strategy and run a Test Failover and real Failover.

Planning the DR strategy

The DR strategy is enforced through the concept of DR Plan where we are going to help plan the different parameters that sustains the strategy including defining the protected resources, the orchestration order of the recovery process, and several additional options when the failover executes like changing the IP adresses or executes scripts.

Create a DR Plan

A DR plan defines the orchestration configuration for implementing the disaster recovery Strategy.

The following operations are allowed under the DR plan section:

  • Configuring DR Plans – require defining where you want your protected data moved to when the plan runs.
  • Viewing DR Plans – shows the currently defined plans along with plan summary information: the current status, protected and recovery sites, and the last run compliance check results.
  • Activating DR Plans – can be in an active or deactivated state.

In order to create a DR Plan, I need to click on Create plan from the DR plans Menu.

The List of already created DR plans appears.

Just give it a name and choose between using an existing recovery SDDC (Pilot Light) or make the SDDC deployed when a DR occurs.

In the next step, I have to select the source SDDC that is going to be my Protected site in this scenario.

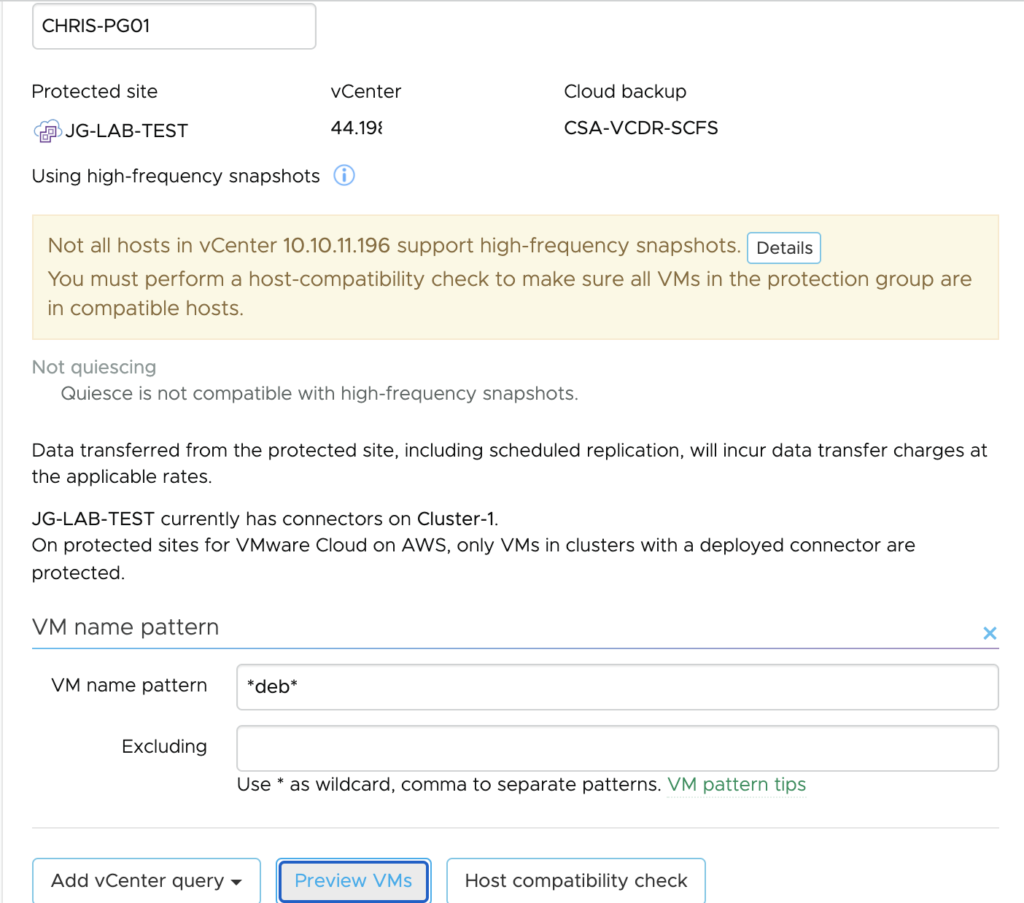
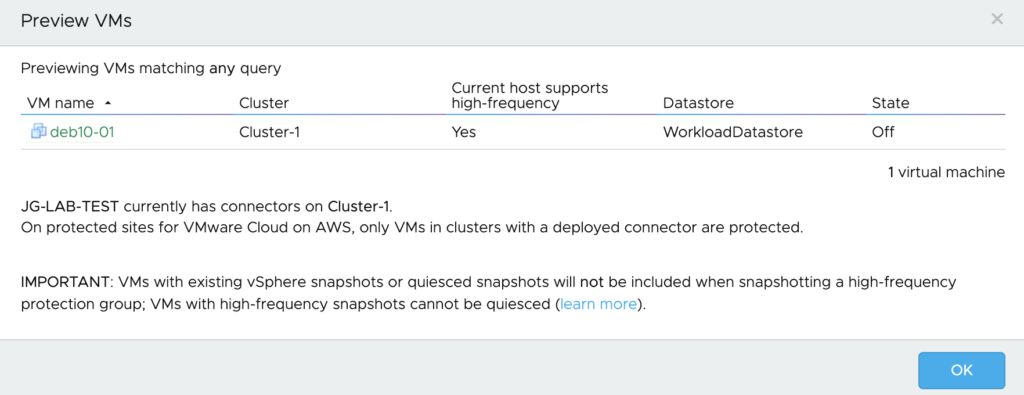
I chose the Protection group I defined earlier.

Next steps are to map the different resources (datastores, folders, resource pools, virtual networks…) from the Protected to Recovery site.

It’s very important to map differences between the sites for smooth recovery, ensuring that vSphere configurations and parameters are mapped consistently between sites.

For folder, I have mapped my Workloads folders on both sites.

I kept the same mapping for the Resource pools and picked Compute-ResourcePool as this is where workloads are running in a SDDC.

For the segments, I have mapped the source segment to a different subnet in the recovery SDDC.

Keep in mind that Test and failover mappings can be different by unselecting the Same for test and failover button. Maybe you want to use a different subnet for testing (for instance an isolated one).

If you do a test, it will then follow the mapping setup in the Test mapping tab.

Next thing is the IP address mapping rules that’s helping to change the range of IPs, subnet masks and DNS settings at failover time. It does that by interacting with the VMTools in the VM while it’s running.

You can change the IP/mask/DGW/DNS address on a range basis or an Individual IP addresses basis.

Next thing is the ability to execute a script of any language for both Windows and Linux machine types from a script host. The script can be executed at a specified time from this script VM. The script VM need to be running in the Recovery SDDC and available from the vCenter of the recovery SDDC . You will call the script from the VM with any parameters you want to be running during the failover sequence.

To finish, the Recovery Steps will specify the order in which you want your VMs to be recovered.

There are different  options under the Recovery Steps.

  1. Choose a step which can be executed for either whole protection groups or an individual VM under the protection group.
  2. Select the Power action for recovered VMs.
  3. Select Pre-recover or Post-recover actions from the drop-down menu which can be running scripts which were saved under step 4 above.

For exemple, I chose to recover one VM first (could be a DB for instance), add a delay of 30 seconds, recover the remaining VMs (could be the remaining App VMs) and ask for a validation.

Lastly after you build the plan you can configure alerting.

Please note that vCDR uses the AWS mail service to send alerts. Recipients must respond to an email address verification Request before getting email from vCDR.

I did receive that email:

The validation occurred after I clicked on the link above:

Now it’s time to test the Plan and execute a failover.

Validating compliance of a DR Plan

In order to make sure the failover going to work, vCDR is performing a couple of compliance check. Continuous compliance checks verify the integrity of a DR plan and ensure that any changes in the failover environment do not invalidate a DR Plan’s directives when running.

Once a DR Plan is completed, the ongoing compliance checks runs every half an hour. It’s checking all the steps in the DR plan including the mappings, the source and destination environment availability and it keeps tracks of the mappings.

As I have opted in for it, at the end of the compliance check, I have received a Report by email with all the results of the checks.

The report shows a folder mapping that wasn’t including the VMs in my Protection Group so I did add the root folder in the mapping.

I forced a new compliance check by clicking the right arrows button.

There were still an error related to the proxy agent VM that vCDR automatically deployed in the SDDC.

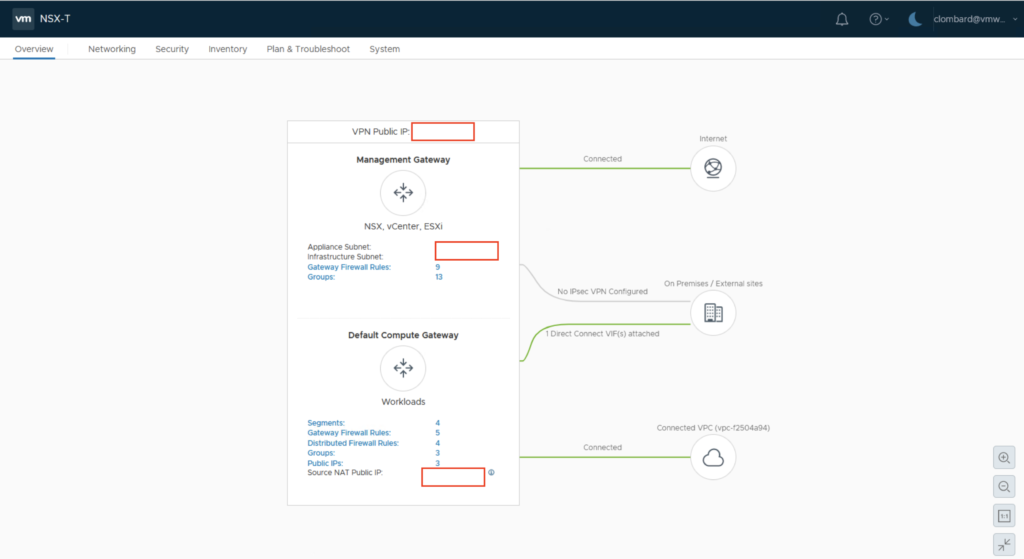
Indeed there is a Cloud PRXY DR VM that have been created on my recovery SDDC as you can see.

This proxy VM is attached to a newly deployed network.

The created network is dedicated to the cloud DR proxy VM and it has the following subnet: 10.68.97.0/26.

Executing a Test

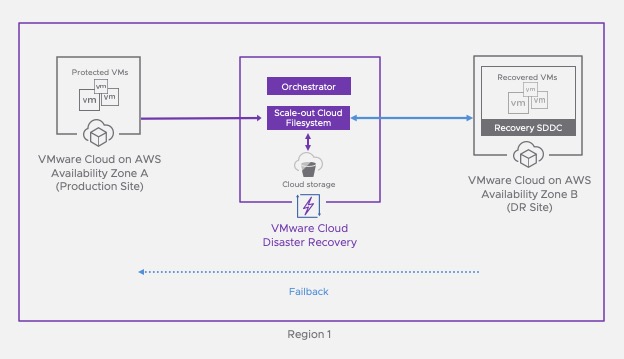
Every plan has the option to do a Test Failover or an actual Failover. The difference between a Failover and a Test is that a fail back will be required post a Failover where in a test you are just bringing a copy of your VM in the cloud and a fail back is not needed because you don’t want to overwrite the existing VMs on premise.

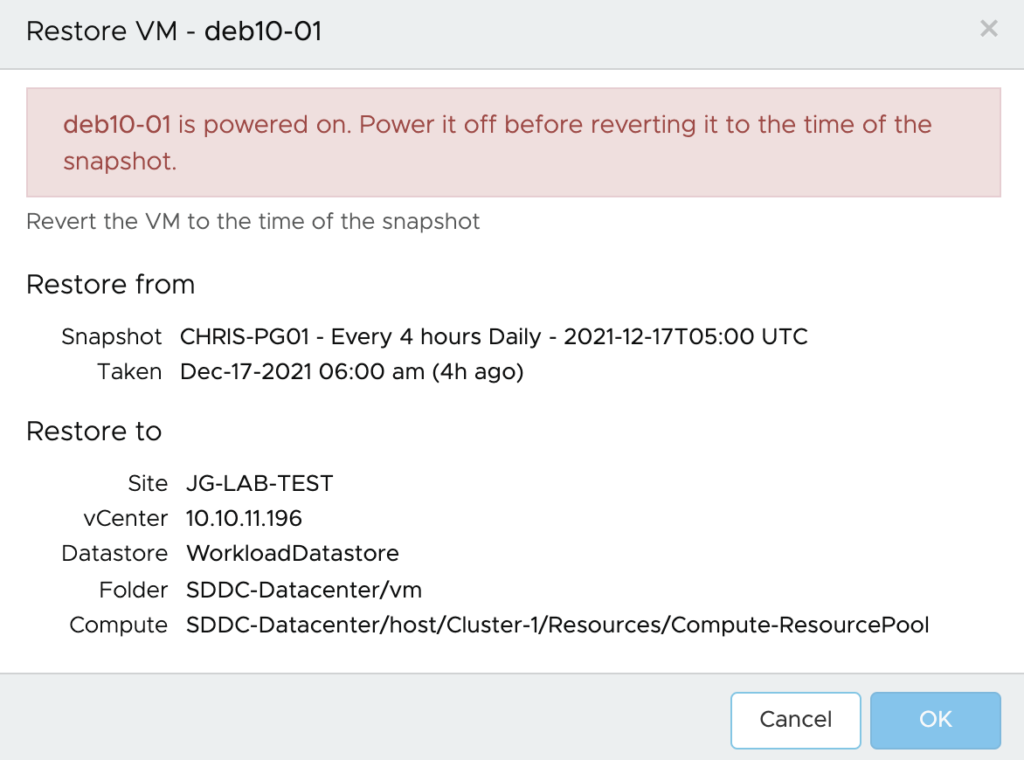
A failover means the production is down, so during a failover you actually take the VM to DR Site up and running. During a failover you will be ask which recovery point you want to pick.

A test failover runs in the context of its own test failover environment, specified by the DR plan’s test mapping rules. The results of the test failover do not permanently affect a target failover destination.

In order to test my plan, I just clicked on Test from the DR Plan menu.

The DR Test ask for which recovery Point within your catalog you want to pick.

You cab select any one of them in the entire protection Group. We can go back to any recovery point.

I have followed the wizard and first selected Ignore all errors.

With the Test, I had the option to run the VMs directly from the cloud backup which is the Cloud Filesytem sitting on top of S3 or to do a Full storage migration to the Recovery SDDC. The latest one means just after the VMs will be registered in the Cloud, they will be “storage vMotioned” from the SCFS into the vSAN Datastore of the SDDC. Obviously running the VM from the Cloud backup will not be as fast as all flash vSAN.

I kept Leave VMs and files in cloud backup for this test.

I confirmed that I wanted to kick off the test by writing TEST PLAN and clicked Run test.

After the test started, it has populated the VM in the Recovery SDDC.

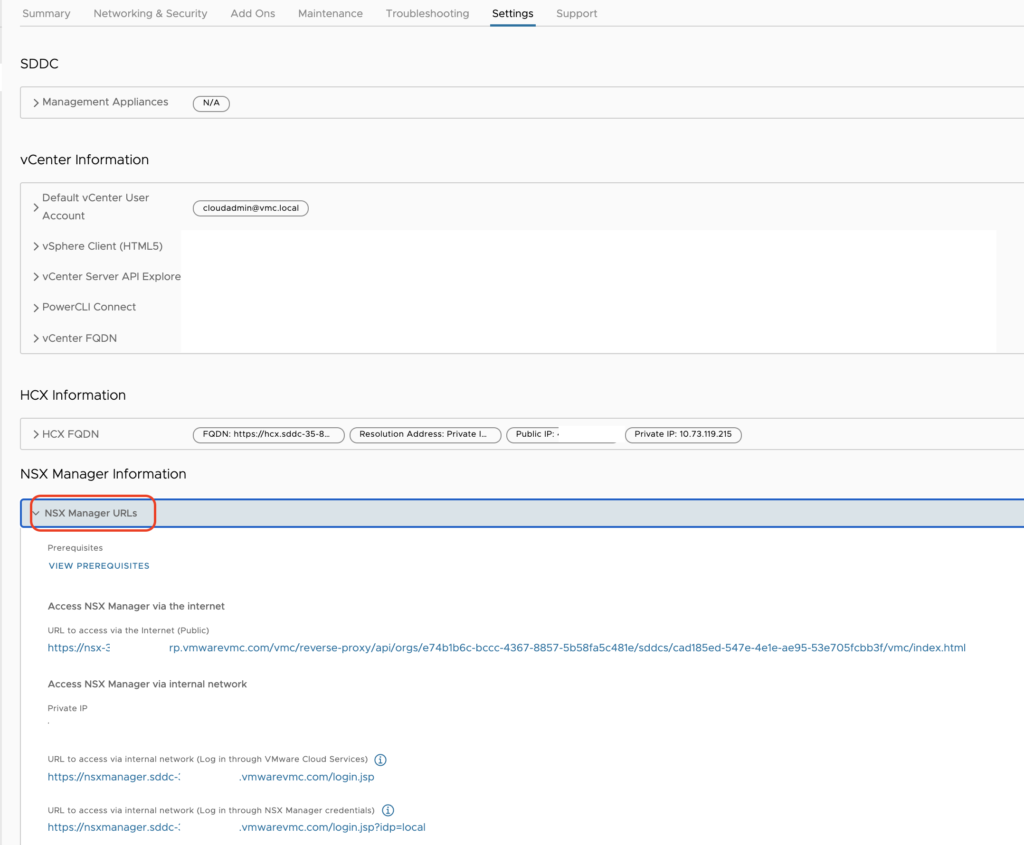
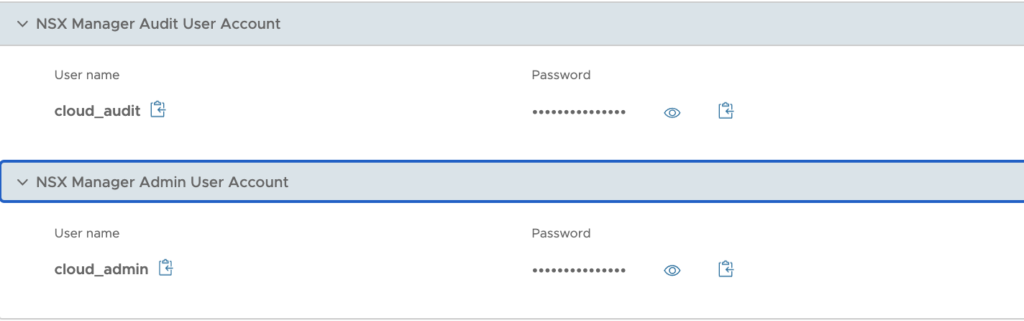
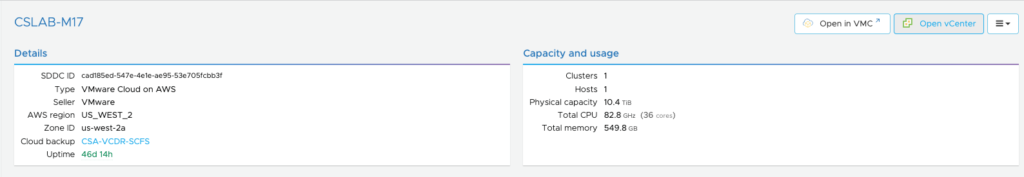
So I have launched the Recovery SDDC vCenter from vCDR portal and could copy the credential as they are captured in it (very handy!).

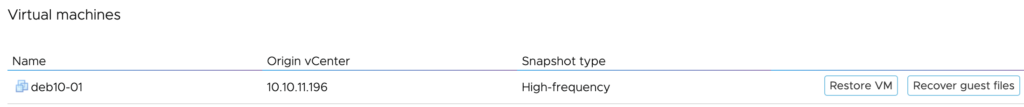
I could see the my Two VMs in the Protection Group have been restored.

Once the test is over, you have to clean up the test by undoing the tasks, unregistering the VMs and revert back to initial state.

The clean up process is deleting the VMs from the SCFS as you can see.

The two VMs get unregistered from my vCenter.

Everything that have been done during my failover test is documented and is available through a pdf report where every steps is detailed.

I have generated it from the DR Plan Menu.

The Pdf report was autogenerated and downloaded in my local folder.

The report has multiple pages and is quite detailed as it includes the results of my test, the workflow steps, mappings and the time that it took per VM to come up, …

This is a great document to share with compliance people inside the organization.

That concludes my latest post of the year. Enjoy en of Year Celebration and see you next Year!

Using VMWare Cloud DR to protect VMs in an SDDC. (Part 2 – Protecting VMs)

In the first post of my series on Using vCDR to protect VMs in an existing SDDC, I have showed you how to configure an existing SDDC as a Protected Site.

Next thing to do is to start selecting the list of VMs running into the cloud that you want to protect with vCDR in a Recovery SDDC.

Protecting VMs running in the SDDC

It’s possible to protect VMs with vCDR by leveraging the concept of Protection group.

A Protection Group helps create a collection of VMs replicated to the cloud which can be then used as a group for recovery. You can create multiple groups of VMs through multiple Protection Groups.

Create a Protection group

Creating a Protection Group is very simple!

I have just clicked on the button Create protection group from my SDDC in the Protected sites menu.

I am then presented with a wizard to name the Protection Group, select my source SDDC vCenter and define Group membership.

In order to select the list of VMs, I have to create one vCenter query that defines the protection group’s dynamic membership.

A vCenter query is defined using:

  • VM Name pattern: a name pattern is a regex entry that supports wildcard and exclusion
  • VM Folder: a folder where my VMs run
  • VM Tags: vSphere Tags for quickly identifying the logical membership of VMs

The vCenter queries are evaluated each time a snapshot is taken and define the contents of the snapshot.

There is an option to use High-frequency snapshots. This option is really interesting as it brings RPO to as low as 30 minutes and allow for 48 snapshots a day.

There are a few caveats for enabling hfs such as vCenter and ESXi host version that must be updated to vSphere 7.0u2c+.

I was able to select it with the current version of my SDDC after launching a compatibility check.

I choose the following pattern for my VMs : *deb* in order to pick only my test Debian VMs.

I checked by clicking on the Preview VMs button.

It is important to mention that any additional VMs that are going to match that pattern will be automatically added to the group.

I can also do the same by selecting a VM folder.

Setting up a backup Policy

Once you have your VM selected, next step is to define a backup Policy with specific snapshot/replication schedule and retention time.

Snapshot schedule will define how frequently you want to take snapshots of the VMs defined in the group. You also define how long you want to retain those snapshots on the SCFS by selecting the right retention time.

I have been doing a lot of backup solution configuration in my past job as a EMC technical Consultant and I remember a few best practices that I wanted to share with you.

Forming a good Backup Strategy, you would implies

  1. Determine what data has to be backed up
  2. Determine how often data has to be backed up
  3. Test and Monitor your backup system

From the backup perspective and in order to fulfil common RPO needs, I have established the following schedule (it has to be adapted to workloads criticality):

  • 4 hours with 2 Days retention
  • Daily with 1 Week retention
  • Weekly with 4 Weeks retention
  • Monthly with 12 Months retention

The minimum replication (best RPO possible) is 30′ but here I didn’t choose this frequency. The more you replicate, the more you keep it in the cloud, the more capacity you would need on the cloud site for recovery perspective.

Important: Research indicates most victims of ransomware don’t discover that they have been compromised until an average of 3-6 months after the initial infection, so choose the retention period accordingly. 

Once you have defined your replication strategy and protection schedule for your group of Virtual Machines, the snapshots/replicas are going to start populated in the protection group.

I can click on any snapshots and see the VMs inside.

I have the option to restore any image of my VM back to on-premise. This an image level backup so this is going to overwrite the VM on-premise. So the VM has to be powered down before doing so.

Configuring a recovery SDDC

VCDR provides two deployment methods for recovery SDDC.

  • On-demand: also known as “just in time” deployment
  • Pilot Light: a small subset of SDDC hosts ready to take over the VMs in case of a DR for workload with lower RTO needs

For this post, I already have configured an SDDC in a different region and AZ for the purpose of recovering my test VMs.

As you can see there is a single host in it. It always possible to scale it up and add additional hosts in it. You can always create a single node SDDC for DR testing and then scale it up later.

You can also customize the recovery SDDC from here by adding new network segments, Compute Gateway FW rules, NAT rules or new Public IPs for instance.

To bring every thing together and finalize the DR Strategy, I need to create a DR Plan and test it.

I will cover that in the final post of my series.

Using VMWare Cloud DR to protect VMs in an SDDC. (Part 1 – Deploying vCDR)

VMware Cloud Disaster Recovery is currently the solution that has the most interest from my customers and partners. It’s a solution that offers the best way to deliver an on-demand easy-to-use cost effective DRaaS solution for workloads running on-premise.

A few months ago, it added the ability to protect cloud workloads running in VMware Cloud on AWS with inter-region DR failover (i.e. failover from one region to another region).

Very recently, the solution has now the ability to protect cloud workloads running in VMware Cloud on AWS with intra-region DR failover (i.e. failover into a different availability zone (AZ) within the same region).

Let’s see how we can leverage this to protect workloads.

Deploying vCDR in VMC on AWS

Accessing the vCDR dashboard

First of all I need to access the CSP Console and locate the VMWare Cloud DR tile under the My Service menu.

If I click on the tile here it brings me to VMware Cloud DR landing page.

As you can see it looks very similar to the CSP page. The development team have been doing a great job integrating vCDR in the Services portal.

Currently the dashboard is showing you the health capacity and especially the number of protected VMS, the number of Protection groups, as well as the replication direction of each of your protected sites and recovery SDDC.

In my current Demo environment, there are 3 protected on-premise sites and one recovery SDDC (CSLAB-M17).

Fan in architecture model is supported: 3 sites and 1 SDDC currently protected to CSLAB-M17

The cloud backup site where the Scalable Cloud Filesystem stands is CSA-VCDR-SCFS.

On the left, I can see the replication events and any recent alarms and alerts displayed.

Adding the SDDC as a new Protected site

In this lab, the Scalable Cloud File system has already been deployed. So we can directly jump into the deployment of the vCDR connector on my VMC on AWS SDDC by clicking the Set up a protected site link menu.

Here I choose VMware Cloud on AWS and Click Next.

The list of SDDCs in my organization are then displayed. I can see that only the SDDC that is in a different AZ from my SCFS can be used. So I picked the SDDC in US East North Virginia region.

Here I am presented with two choices: manually create the Gateway Firewall rules or leave vCDR automatically add the right rules. The DRaaS Connector is a VM that has to be deployed on a Compute segment in the SDDC. I decided to choose Automatic and pick the default segment of my SDDC. Obviously it’s up to you to choose another segment dedicated for it.

If you are not sure which option to select, see Network Considerations for a Protected SDDC for more information.

To finish the site creation I clicked Setup.

After a few seconds, the SDDC (JG-LAB-TEST) appears as a Protected Site.

Deploying the DRaaS Connector in the newly protected SDDC

Once the site is configured, the next step is to deploy the DRaaS connector which would enable the SaaS orchestrator communicate with the Protected SDDC vCenter. Refer to the Documentation for the VM CPU and network requirements

This process is quite straight forward. Just click on the Deploy button.

You will presented with a screen that explains every steps.

First of all you have to download the virtual appliance that will enable connectivity from the SDDC to the Cloud filesystem, second connect on the console to finish setting up the IP and to enter the Cloud orchestrator FQDN.

Make a note of the Console credentials, which you need to log in to the VM console: admin/vmware#1. Also copy (or write down) the Orchestrator Fully Qualified Domain Name (FQDN), which you need when you configure the connector in the VM console

A few things you need to know:

  • Do not name the DRaaS Connector VM using the same naming conventions you use to name VMs in your vSphere environment.
  • Avoid giving the DRaaS Connector VM a name that might match the VM name pattern you use when you define protection groups.
  • If you are deploying the DRaaS Connector to a VMware Cloud SDDC with more than one cluster, you must choose a cluster to deploy the connector VM on. Each cluster in your SDDC must have the connector VM deployed on it in order for the VMs running on the cluster to be added to protection groups and replicated to a cloud backup site.
  • Do not use non-ASCII characters for the connector name label.

After downloading the OVA by using the URL, I have uploaded the OVA to a Content Library in my SDDC. And started the deployment of the OVA.

I gave it a name.

The only Resource pool that I can choose is the Compute-ResourcePool.

The Storage datastore can only be WorkloadDatastore.

I have chosen the default compute segment (sddc-cgw-network-1).

I am then presented with the final page of the wizard and I click finish to launch the deployment.

After a few seconds, the Connector Virtual Machine appears in the inventory. I just started the VM to be able to continue the setup.

Finishing configuring the Cloud Connector in the SDDC

Second phase of the deployment is to setting up the networking.

Once the VM has started, I have had to open a console from vCenter in order to finish the configuration I have had to connect with credential presented is the latest window: admin/vmware#1.

I have typed ‘a’ to start Static IP allocation and entered a new IP address and subnet mask plus a DNS IP address (I picked the google one).

Next step is to enter the Cloud Orchestrator FQDN.

And to achieve the configuration the site specific pass-code…

and the site label (I kept the same name as the VM).

After a few seconds, I received a Success message to inform me that the setup was achieved.

To finish this phase, I have checked that the right firewall rules have been created in my SDDC.

With the newly added rule, the segment where the Cloud Connector runs has access to the Cloud Orchestrator in the cloud with SSH and HTTPS, to the SDDC vCenter, and to the Auto-support server in HTTPS. Finally it has also access to the scalable Cloud File System on the port TCP 1759.

That’s conclude the first part of this very long series of post on vCDR.

In my next post I am going to show you how to start protecting VMs in the Protected SDDC!

NSX Manager Standalone UI for VMC on AWS

Today I want to focus on the new feature from M16 release that enable customer to have a direct access to NSX Manager UI.

This is for me an interesting capability especially because it gives access to a more familiar interface (at least for customers that already utilise NSX-T) and it also reduces the latency involved with the CSP Portal reverse proxy.

In addition, it enables the access to NSX-T TraceFlow which will be very helpful to investigate connectivity issues.

Let’s have a look at this new Standalone UI mode.

Accessing the standalone UI

There are two ways to access the NSX Manager Standalone UI in VMC on AWS:

  • Via Internet through the reverse proxy IP address of NSX Manager. No particular rule is needed on the MGW.
  • Via the private IP of NSX Manager. It’s the option you will take if you have configured a VPN or a Direct Connect. A MGW firewall rule is needed in that case.

In order to choose between the type of access that fits our needs, we need to select it in the Settings tab of the VMC on AWS CSP console.

There are two ways to authenticate to the UI when leveraging the Private IP:

  • Log in through VMware Cloud Services: log in to NSX manager using your VMware Cloud on AWS credentials
  • Log in through NSX Manager credentials: log in using the credentials of the NSX Manager Admin User Account (to perform all tasks related to deployment and administration of NSX) or the NSX Manager Audit User Account (to view NSX service settings and events)

Both accounts have already been created in the backend and their user name and password are accessible below the URLs.

I have chosen the Private IP as I have established a VPN to my test SDDC.

So prior to accessing the NSX Manager, I have had to create a Management Gateway Firewall rule to allow source networks in my lab to access NSX Manager on HTTPS (the predefined group NSX Manager is used as a target).

Navigating the standalone UI

I started by clicking on the first URL here:

After a few seconds, I am presented with the NSX Manager UI:

Networking tab

Menu from Networking Tab

This tab will give you access to configuring the Connectivity options, Network Services, Cloud Services, IP Management, or Settings.

Basically the settings can be accessed in read only or read/write mode.

Keep in mind you will not have more rights or permissions to modify settings than if you were editing it from the CSP Console.

VPN and NAT options are accessible with same capabilities as from CSP console.

The Load Balancing options is there and is usable only if you have Tanzu activated in your cluster.

For example, for the Direct Connect you can change the ASN number or enable VPN as a backup.

For Transit Connect, you can have a look at the list of Routes Learned or Advertised.

Public IPs allow for requesting new IP addresses for using them with HCX or a NAT rule.

Let see what’s possible to do from the Segments menu.

From here you can see is a list of all your segments. You can also create a new segment, modify an existing segments or delete your segments.

I was able to edit the settings of one of my segment DHCP configuration.

I was also able to edit my Policy Based VPN settings.

All the other options are reflecting what we can already do in the CSP Console.

Security tab

This Menu is divided into two parts:

  • East-West Security that gives access to the Distributed Firewall rules and Distributed IDS/IPS configuration,
  • North-South Security covers internal traffic protection and the Gateway Firewall rules settings.

Nothing really interesting here, it’s pretty much the same as from the CSP Console as you can see here:

On the Distributed IDS/IPS, I can review the results of my previous penetration testing that I did in my previous post.

Inventory tab

This tab is covering:

  • Services: this where you’ll configure new protocol and services you want to leverage in the FW rules
  • Groups: group of Virtual Machines for Management FW rules and Compute Gateway rules
  • Context Profiles: you can basically add new FQDNs useful for the DFW FQDN filtering feature, AppIDs for Context Aware Firewall rule, and set up Context Profiles.
  • Virtual Machines: list all the VMs running an attached to segments with their status (Stopped, Running, …)
  • Containers: will show Namespaces and Tanzu Clusters.

Plan and Troubleshoot tab

The tab is covering:

  • IPFIX: this where you’ll configure new protocol and services you want to leverage in the FW rules
  • Port Mirroring: this permits to setup a target collector VM and then replicate and redirect all trafic from a logical port switch to it for analysis purpose
  • Traceflow: very nice feature to monitor and trouble shoot a trafic flow between two VMs and to analyze the path of the trafic flow.

The last one is a feature not existing on the current VMC on AWS CSP Console and which is to my opinion worth having a look at.

Traceflow option

Let’s have a look more deeply into what this brings onto the table in my next post.

Stay tune!