VMware Cloud on AWS BU have been pretty active this last quarter and after the release of M22 which came with lots of cool new features like certificate authentication for IPSec VPN or IPV6, it’s time to welcome M24!
This version has been released on the 14th of November 2023 and comes with lots of interesting new features that are going to be GA (Generally Available) for all brand new SDDC. Let’s have a look at what M24 offers.
Networking
SDDC Group to Group connectivity
SDDC Groups are an organization-level construct that can interconnect multiple SDDCs together with high bandwidth connectivity through a construct called Transit ConnectTM (which falls under the responsibility of VMware).
So far it was used to provide a highly performant, scalable and easy to use connectivity from SDDCs to SDDCs or from SDDCs to native VPCs or AWS Transit Gateway.
With the release of M24, it is now possible to interconnect multiple SDDC Groups in the same Organization together. This will permits the connectivity not only between SDDC group members but also between members in different groups.
In addition, interconnected SDDC Groups can leverage their existing external connections to a Direct Connect Gateway and/or a AWS VPC and a Transit Gateways.
This can highly benefits customers who has split their SDDCs deployment based on region or business purpose. The SDDC Group to Group connectivity can be enabled through the same SDDC Group UI.
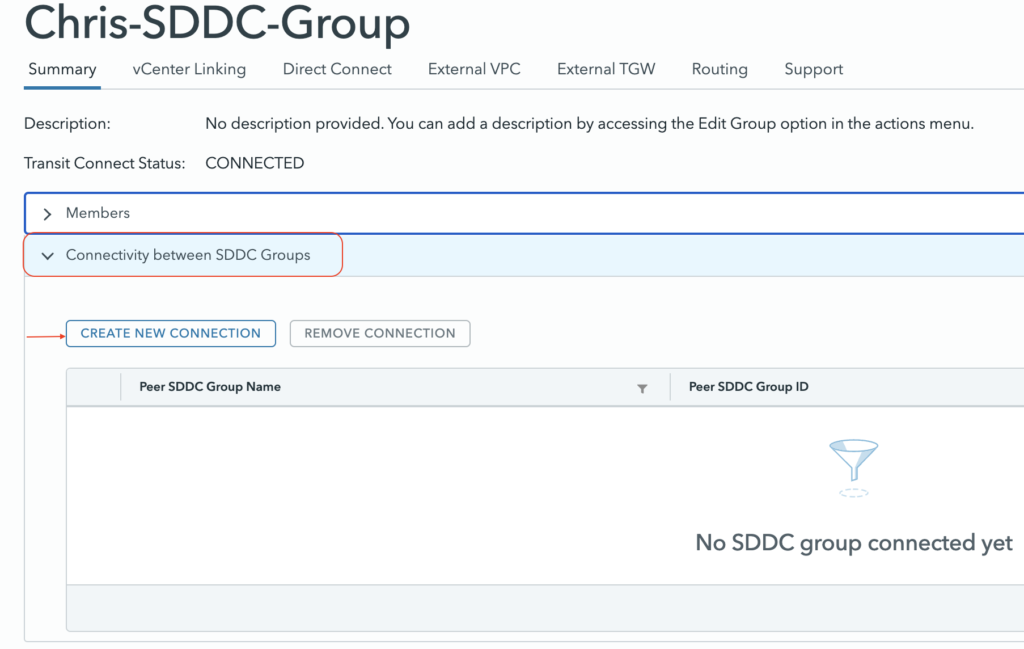
Just pick an SDDC Group that has at least one SDDC deployed in it and it will interconnect the groups.
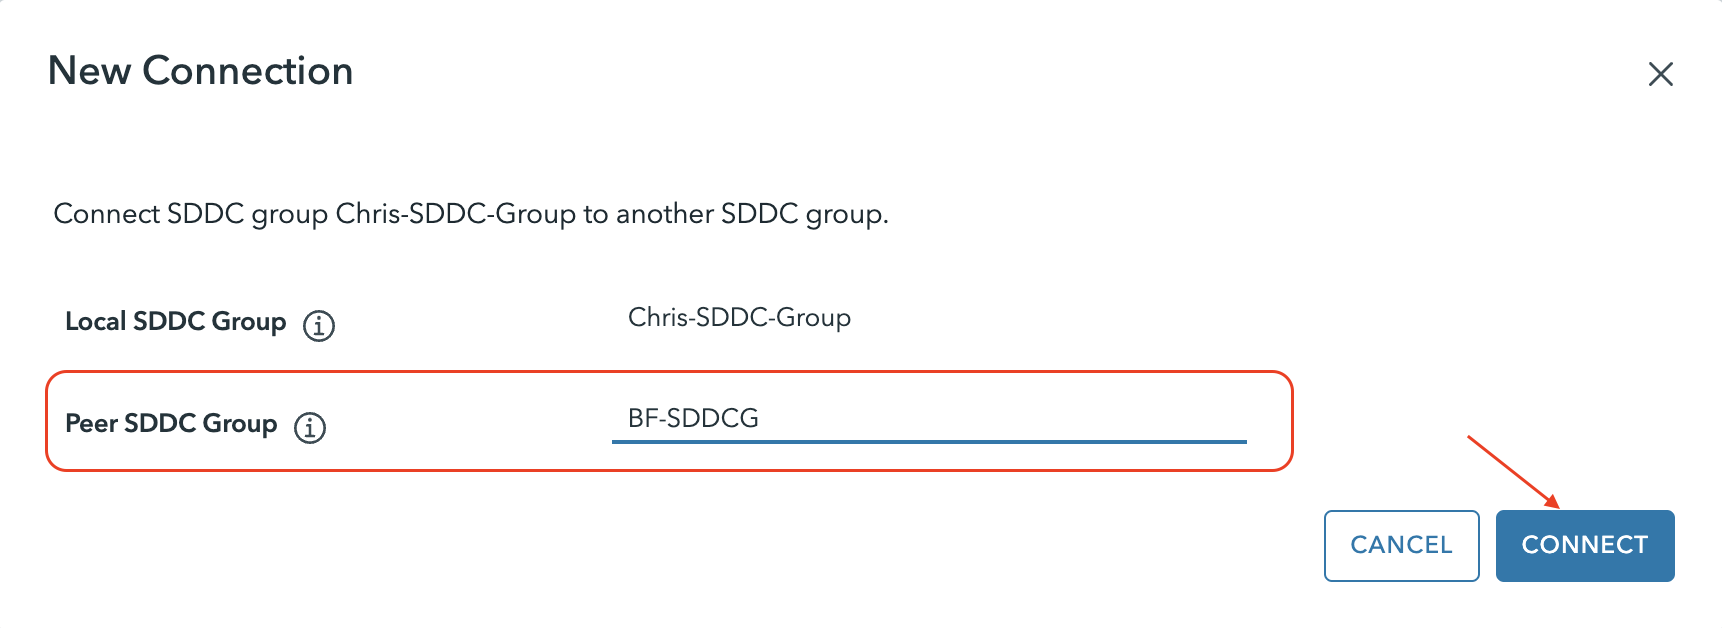
The process automatically peers the groups together.
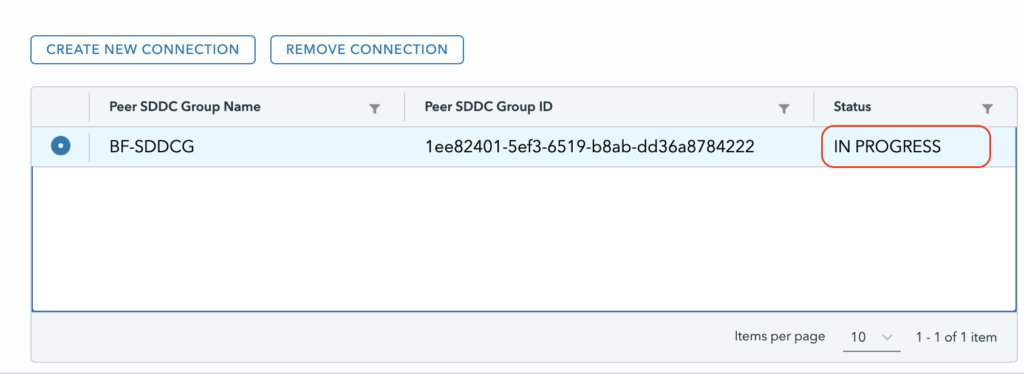
After a couple of minutes it will appear as connected.

NSX Alarms
The new M24 release comes with a new version of NSX equal to 4.1.2. This new version of NSX introduces some new alarm definitions like “Connectivity to LDAP server Lost” which is important when using it for Identity FW rules, or when the IDPS engine has a high memory usage.
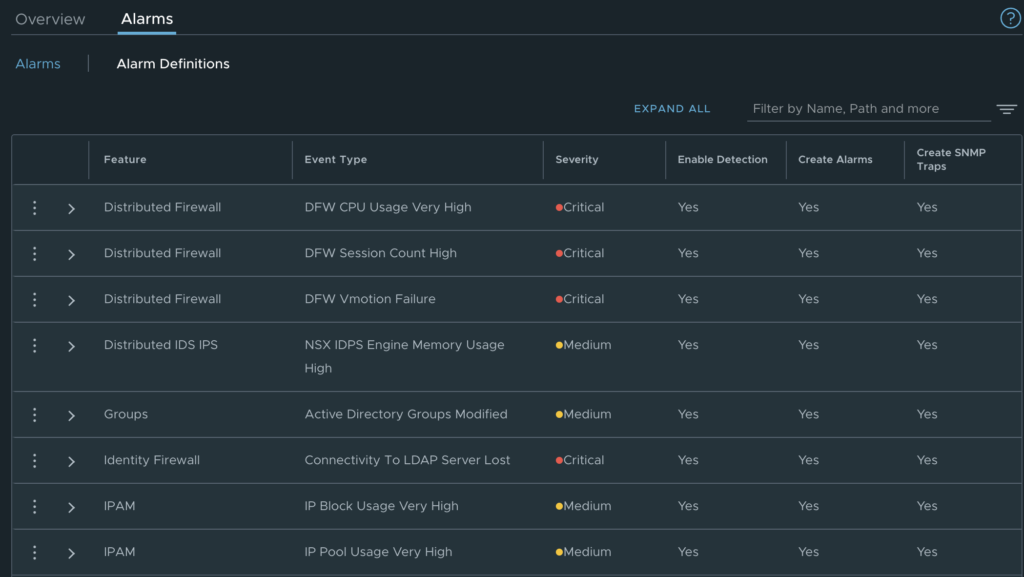
These alarms are automatically triggered each time a corresponding event happens.
NSX new roles
VMware Cloud on AWS will come with 4 new NSX roles in addition to the existing ones providing a greater level of granularity when accessing certain features in NSX Manager.
The 4 new roles are NSX Security Admin, NSX Security Auditor, NSX Network Admin, NSX Network Auditor. The two new Security roles allows for managing the DFW rules and Advanced Security features independently from the other features in a VMware Cloud on AWS SDDC.
The new roles can be selected when creating a new user in the Org under the User and Access Management UI from the VMware Cloud Services Console.
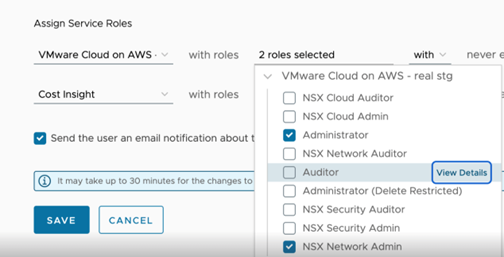
The Security Auditor role will allow users specific Read-only access to the Security configuration objects on the NSX Manager UI.
For a complete view on the privileges for the new roles have a look at this NSX-T documentation page that list the NSX roles and permissions.
Please note that for VMware Cloud on AWS, you cannot clone or create new role and you must rely on the existing roles.
IPV6 support for management
Fore those who didn’t know we have had early availability to IPv6 for east-west traffic only for customers who were requesting it.
Later on IPv6 support has been announced in GA with version M22. In this version, it can not only be activated on segments connected inside the SDDC but also for North-South traffic via Direct Connect and Transit Connect as well as for DFW IPv6 traffic including Layer-7 App-ID. This permits also to create or migrate IPv6 workloads for DC migration or extension use cases.

IPv6 support for East/west in standard and custom T1 GW and for North/South traffic over a Transit Connect.
With M24, we are enhancing again IPv6 support and introduce the support of IPv6 for the management components such as vCenter, NSC manager or HCX using SRE-configured NAT64 FW rules. If you require communication with IPv6 to SDDC management appliances, contact Customer Success Manager or your account representative.
Enabling IPv6 in an SDDC is quite simple, it requires to select the option from the Actions Menu in the SDDC Summary page. This sets up the SDDC for dual stack networking.
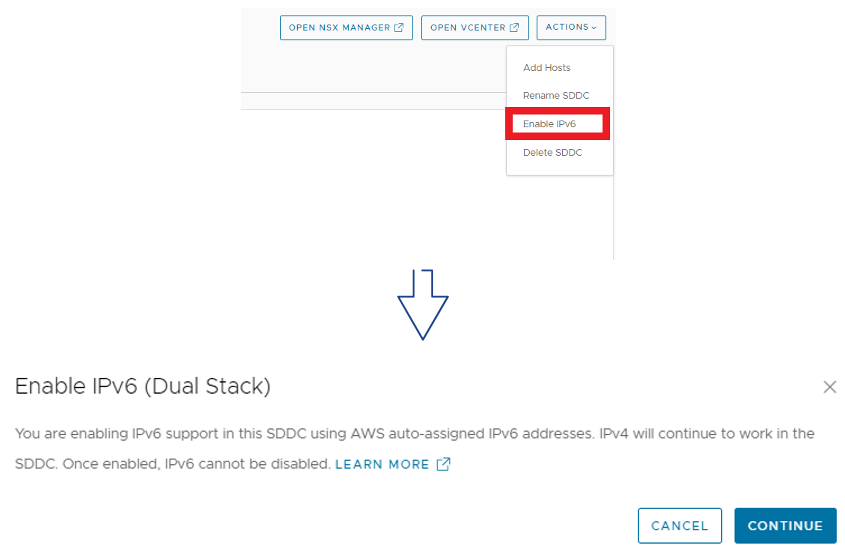
Each SDDC has to be enabled for IPv6 support and once it has enabled it cannot be disabled.
Storage
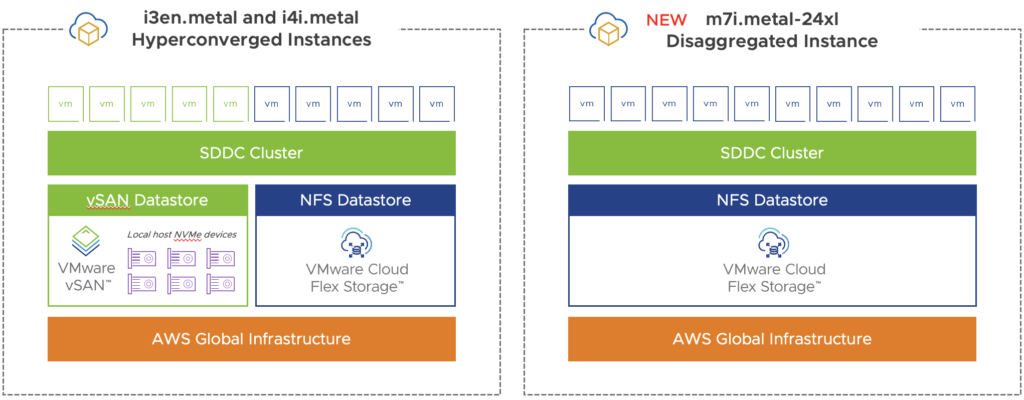
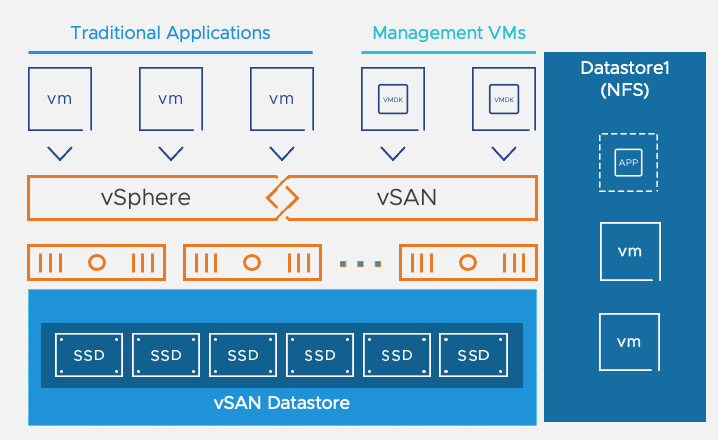
vSAN Express Storage Architecture
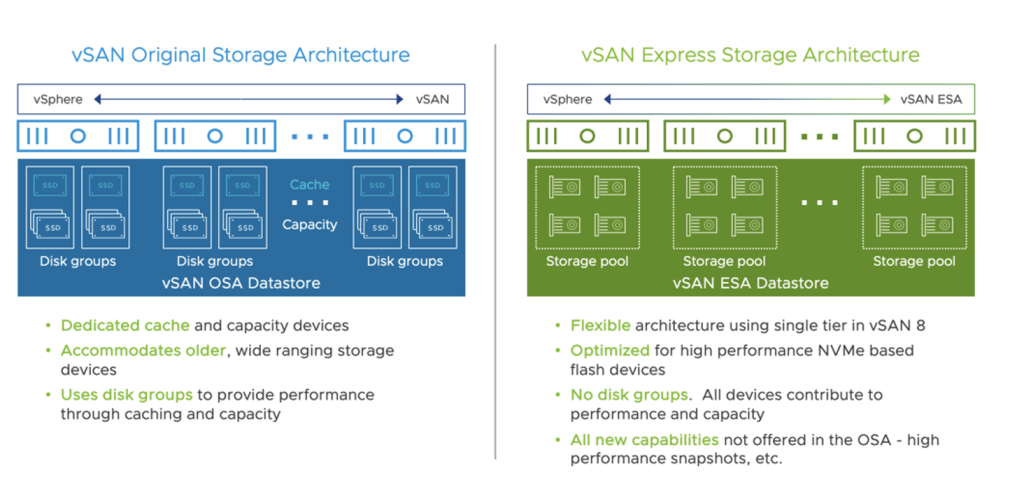
vSAN Express Storage Architecture (ESA) is providing a true evolution in the way storage is managed within an SDDC and it will replace the previous Original Storage Architecture (OSA).
vSAN ESA have been initially released with vSphere 8.0 in October last year. ESA available today on the VMware Cloud on AWS M24 version is the third iteration of ESA.
ESA comes with a lot of features that are going to optimize both the performance and the space efficiency of the storage used in each VMC SDDC and his supported on the new i4i.metal instance for new SDDCs.
Features
vSAN ESA is providing performance and compression increase with more predictable I/O latencies by leveraging a single tier HCI architecture model where each NVMe storage devices serves reads and writes.
It provides the following:
- Native snapshots: Native snapshots are built into the vSAN ESA file system. These snapshots cause minimal performance impact even when the snapshot chain is deep. This leads to faster backups.
- Erasure Coding without compromising performance: A highly efficient Erasure Coding code path allows a high-performance and space-efficient storage policy.
- Improved compression: vSAN ESA has advanced compression capabilities that can bring up to 4x better compression. Compression is performed before data is sent across the vSAN network, providing better bandwidth usage.
- Expanded usable storage potential: vSAN ESA consists of a single-tier architecture with all devices contributing to capacity. This flat storage pool removes the need for disk groups with caching devices.
- Increased number of VM’s per host in vSAN ESA clusters: vSAN 8.0 Update 2 supports up to 500 VMs per host VM on vSAN ESA clusters, provided the underlying hardware infrastructure can support it. Now you can leverage NVMe-based high performance hardware platforms optimized for the latest generation of CPUs with high core densities, and consolidate more VMs per host.
- vSAN ESA support for encryption deep rekey. vSAN clusters using data-at-rest encryption have the ability to perform a deep rekey operation. A deep rekey decrypts the data that has been encrypted and stored on a vSAN cluster using the old encryption key, and re-encrypts the data using newly issued encryption keys prior to storing it on the vSAN cluster.
- Always-On TRIM/UNMAP. ESA supports this space reclamation technique natively and helps release storage capacity that have been consumed by Guest OS and aren’t used anymore.
Benefits
vSAN ESA provides :
- 2,5X more performance at no additional costs
- 14 to 16% more storage capacity for a better TCO when sizing VMware Cloud on AWS SDDCs
- TRIM/UNMAP enabled by default to recover from released storage capacity
The vSAN ESA RAID-5 and RAID-6 deliver a better performance over vSAN OSA RAID-1 without having to consume twice the capacity of storage. ESA Managed Storage Policy supports RAID-5 starting from 3 hosts to deliver better storage capacity for smaller clusters. The gain is estimated at 35% for the same cost!
Requirements
ESA is in Initial Availability (AI) and is available on demand on SDDC version 1.24 or later with i4i.metal instances deployed on a single AZ cluster (standard cluster only).
To enable the feature customers require assistance from the Customer Success team.
vSAN ESA is only available for greenfield SDDC (today).
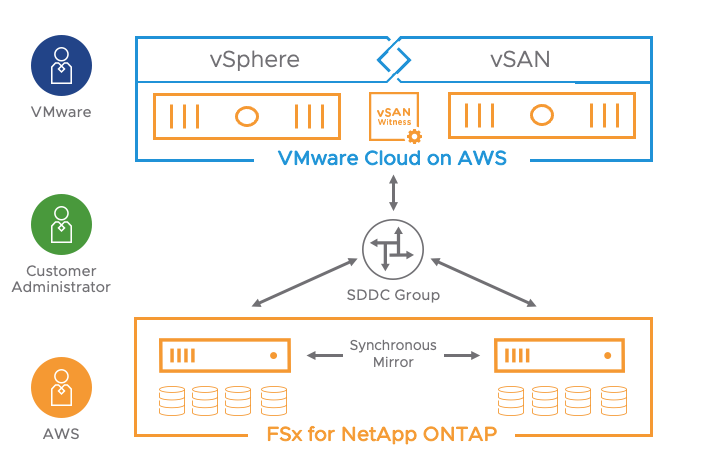
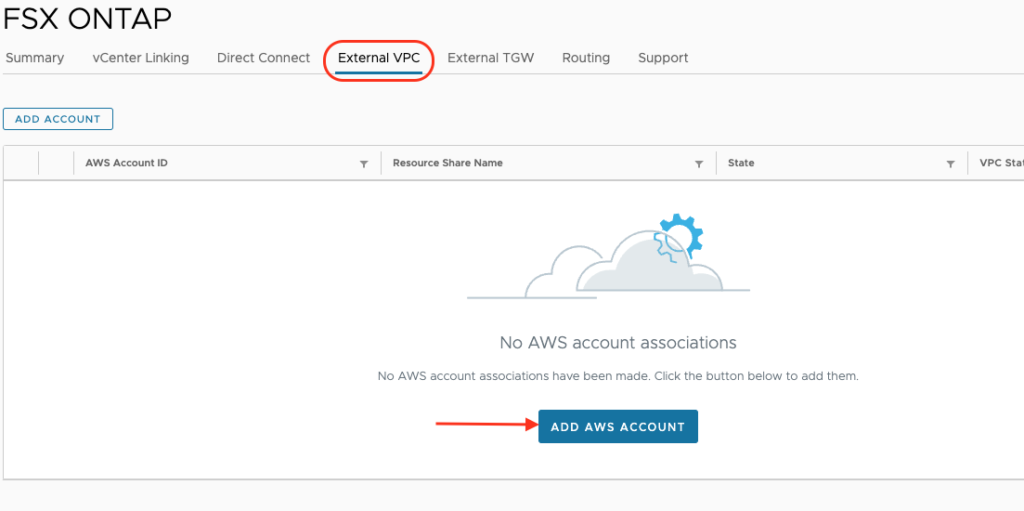
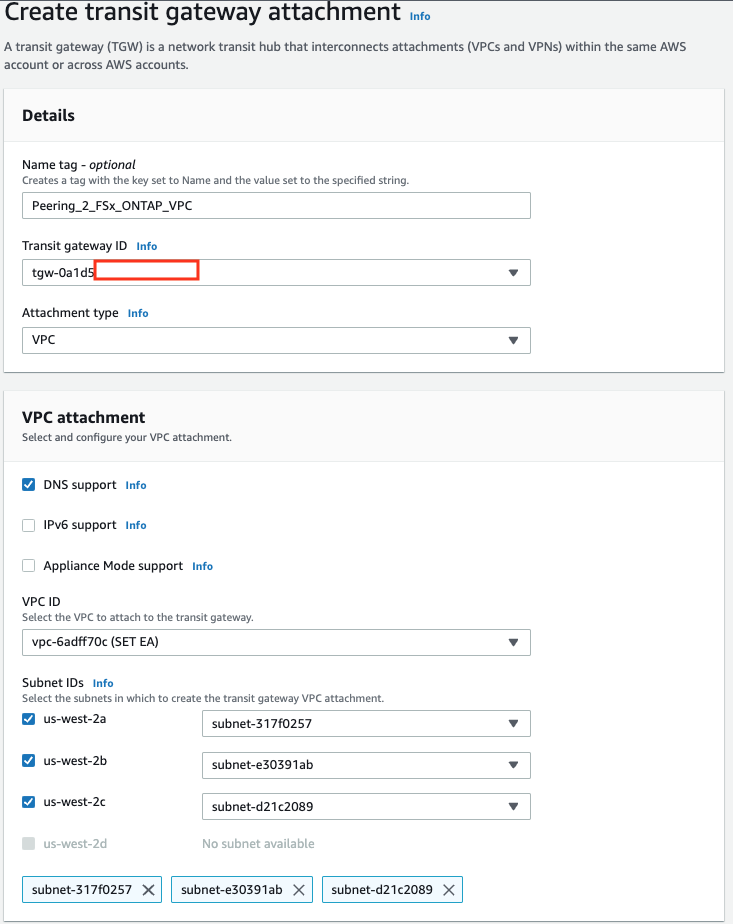
VPC Peering for External Storage
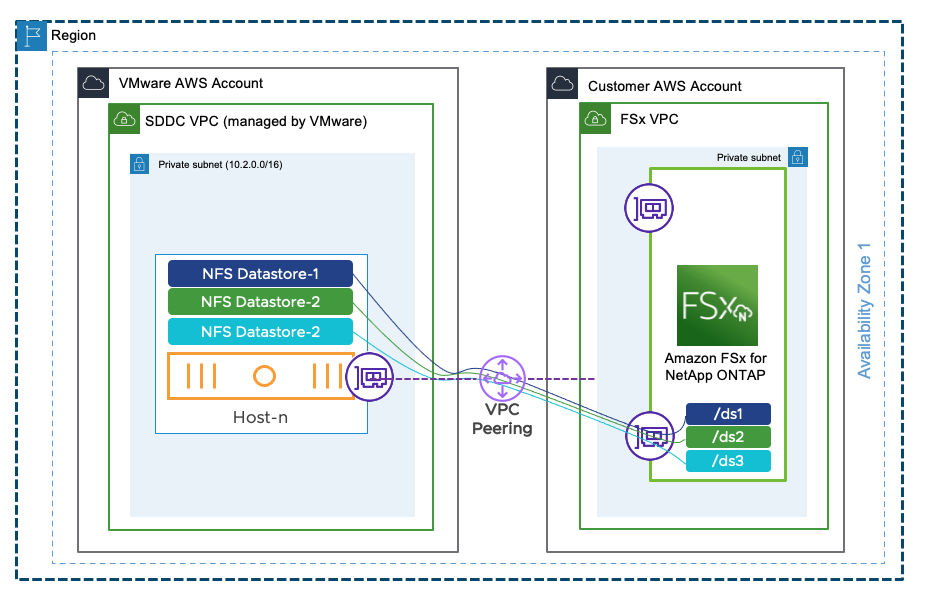
This is one of the most exciting news of all. VMware Managed Transit Gateway is not needed anymore to mount NFS datastore in ESXi hosts. For those who are using a single AZ SDDC, a VPC Peering will be sufficient and there will be no additional cost for that connectivity.
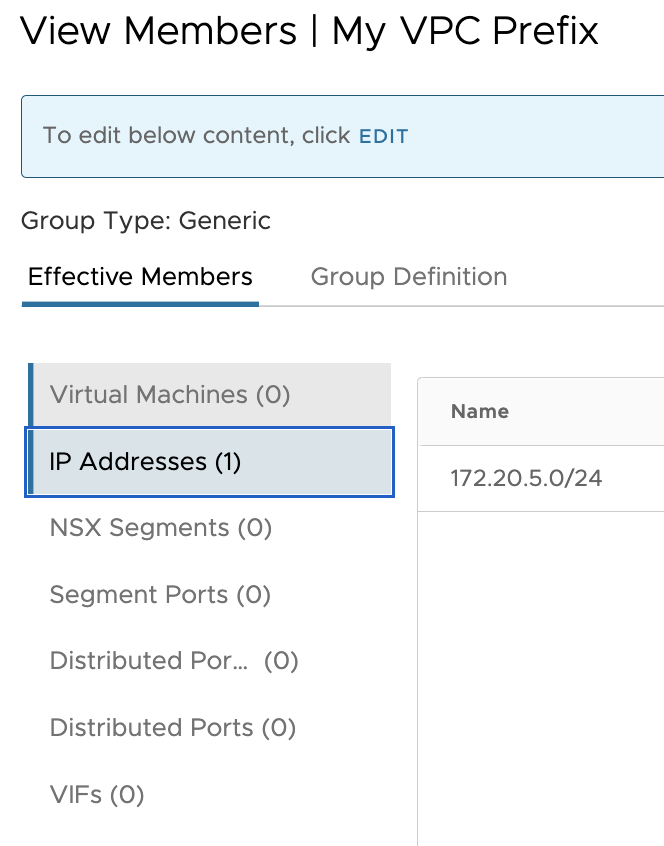
Customers will be able to attach an Amazon FSx for NetApp ONTAP file systems directly to their ESXi over a VPC Peering. This works by establishing a peering connection exclusively for the NFS storage traffic between the shadow VPC managed by VMware and the AWS native VPC.
It is important to note the native VPC where the FSX service is going to be provisioned can be in the same AWS Account as the one where the Connected VPC used to deploy the SDDC is.
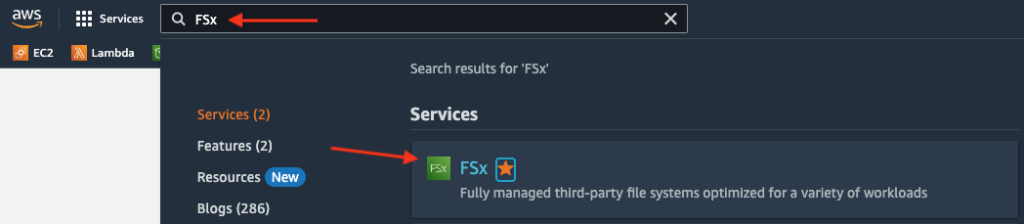
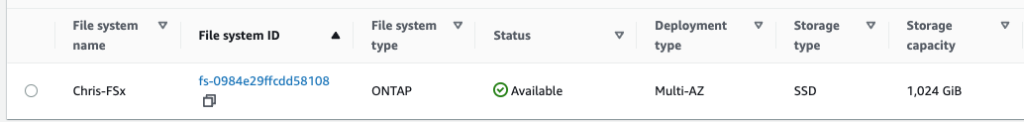
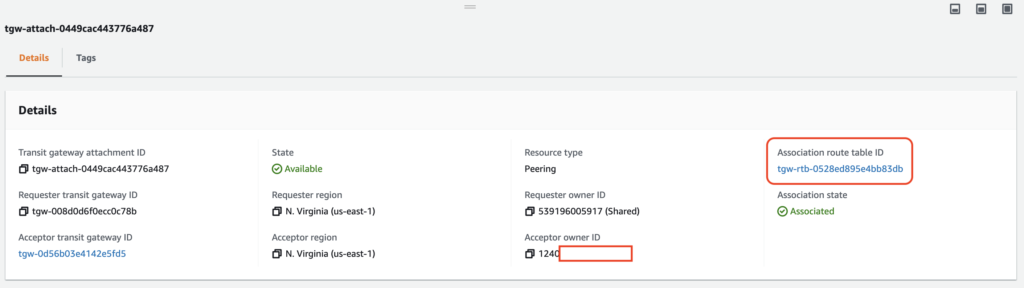
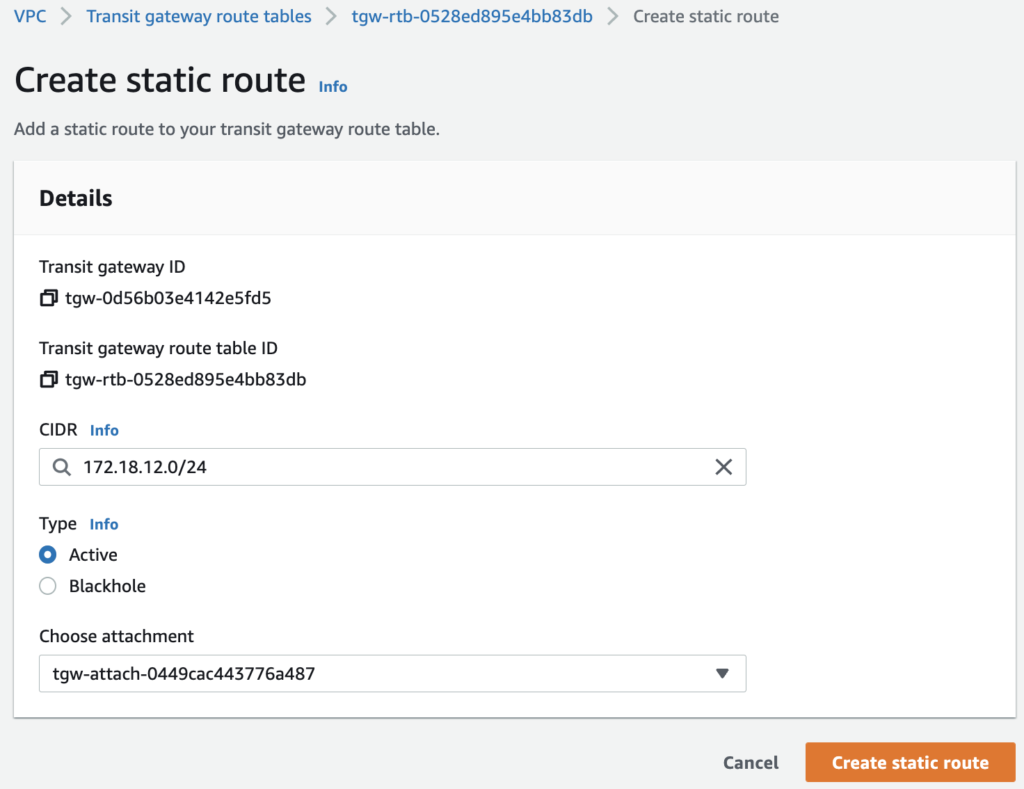
To create the VPC Peering, customers need to contact their Customer Success Manager or Account representative. Based on the information provided (SDDC ID, ORG ID, AWS ACCOUNT ID) VMware SRE will initiate the VPC peering request from the Shadow VPC to the customer VPC. The customer will. have to connect to the AWS console and accept the request to finish the process.
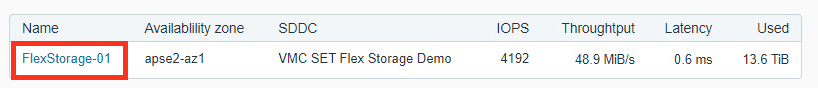
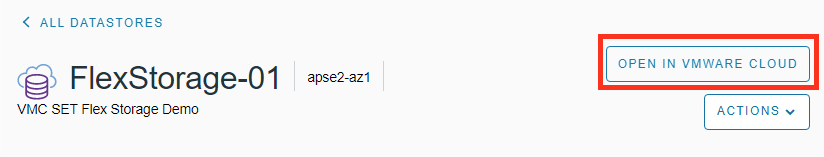
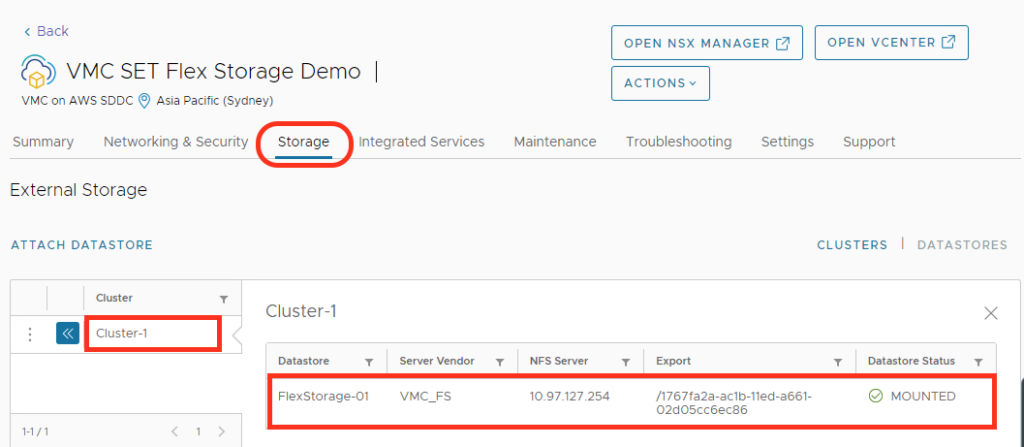
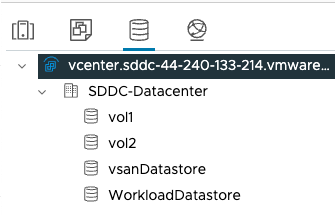
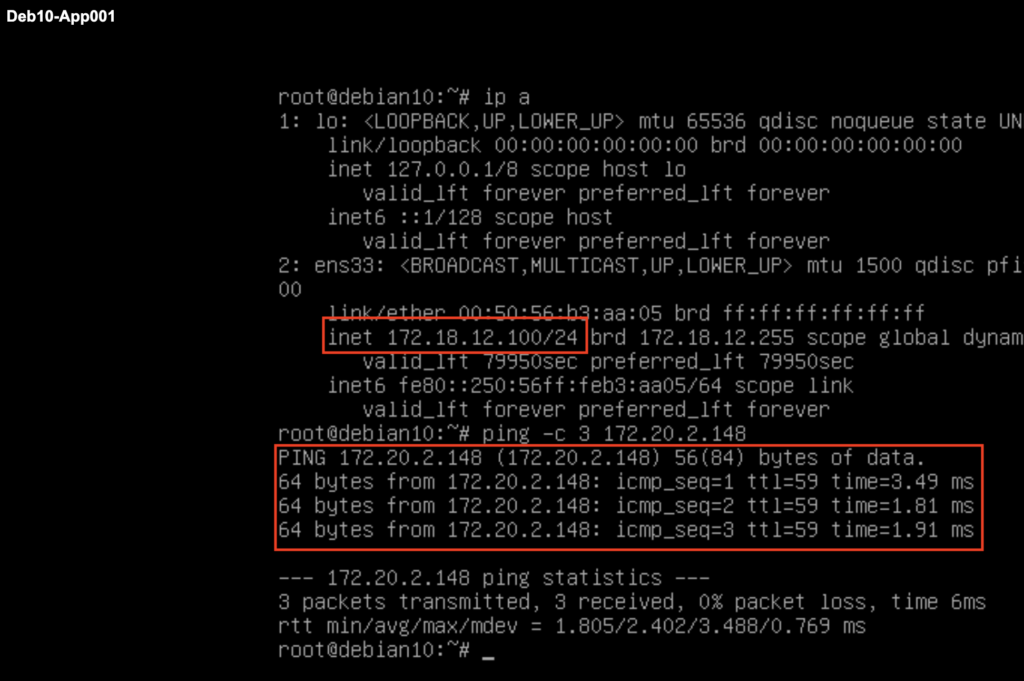
After the VPC Peering has been established, the NFS mounting is possible over the VMC Console by following the same process involved with a Transit Connect, see my blog post here.
Increased NFS Performance
With the release of M24, the MTU of the VMK0 interface (VMkernel) has been increased to 8500. This is going to increase the performance for the large block throughput by up to 20% when using external NFS datastore like VMware Cloud Flex Storage or FSX for Net App ONTAP.
Conclusion
VMware is constantly adding new features to its VMware Cloud on AWS platform to address the constant needs of our customers for security, performance and cost optimization.
VMware Cloud on AWS M24 release is really providing a bunch of nice features and I hope this will help you to better succeed in your cloud migration project.