Today I want to focus on the new feature from M16 release that enable customer to have a direct access to NSX Manager UI.
This is for me an interesting capability especially because it gives access to a more familiar interface (at least for customers that already utilise NSX-T) and it also reduces the latency involved with the CSP Portal reverse proxy.
In addition, it enables the access to NSX-T TraceFlow which will be very helpful to investigate connectivity issues.
Let’s have a look at this new Standalone UI mode.
Accessing the standalone UI
There are two ways to access the NSX Manager Standalone UI in VMC on AWS:
- Via Internet through the reverse proxy IP address of NSX Manager. No particular rule is needed on the MGW.
- Via the private IP of NSX Manager. It’s the option you will take if you have configured a VPN or a Direct Connect. A MGW firewall rule is needed in that case.
In order to choose between the type of access that fits our needs, we need to select it in the Settings tab of the VMC on AWS CSP console.
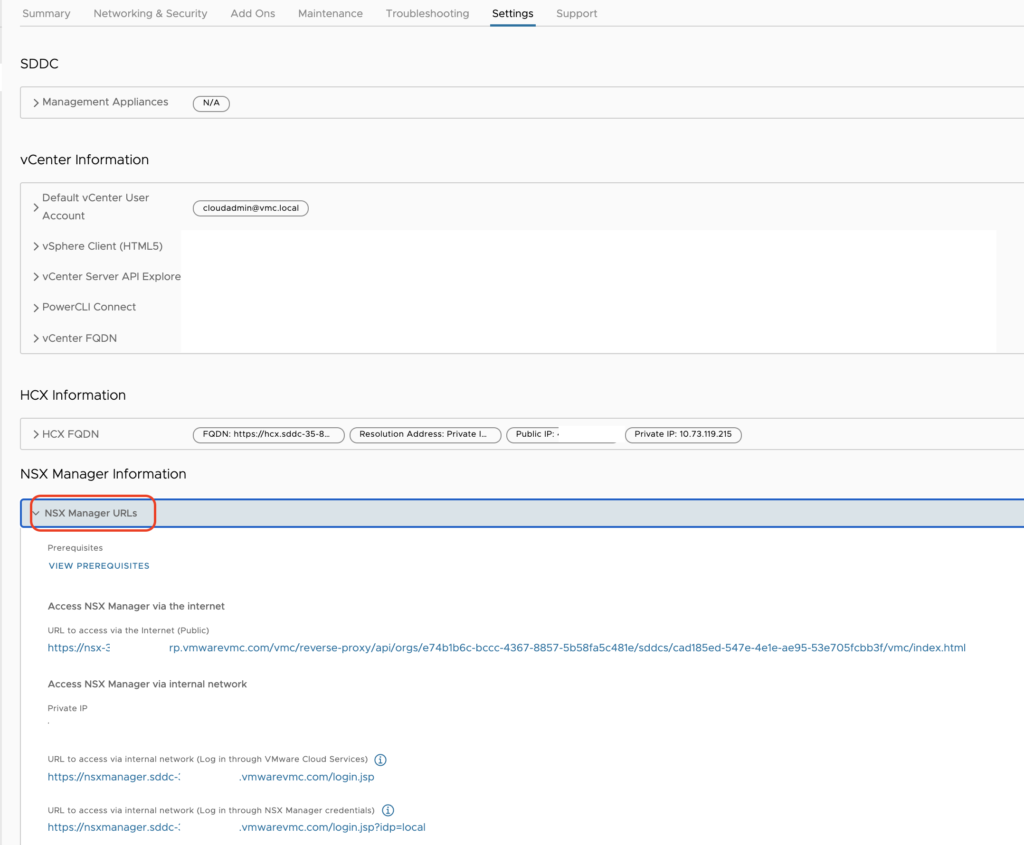
There are two ways to authenticate to the UI when leveraging the Private IP:
- Log in through VMware Cloud Services: log in to NSX manager using your VMware Cloud on AWS credentials
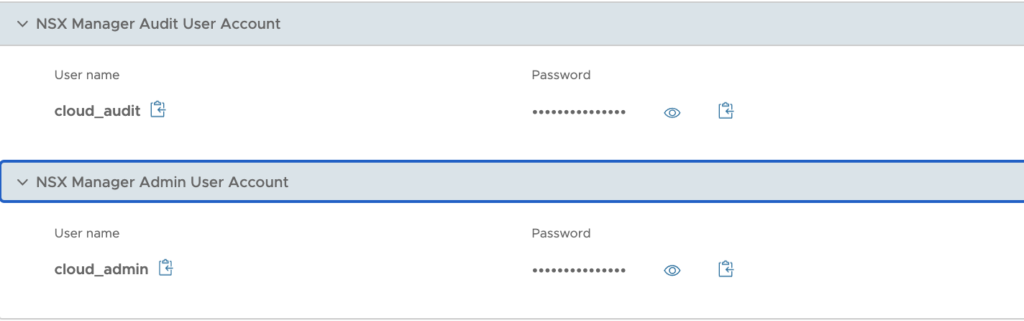
- Log in through NSX Manager credentials: log in using the credentials of the NSX Manager Admin User Account (to perform all tasks related to deployment and administration of NSX) or the NSX Manager Audit User Account (to view NSX service settings and events)
Both accounts have already been created in the backend and their user name and password are accessible below the URLs.
I have chosen the Private IP as I have established a VPN to my test SDDC.
So prior to accessing the NSX Manager, I have had to create a Management Gateway Firewall rule to allow source networks in my lab to access NSX Manager on HTTPS (the predefined group NSX Manager is used as a target).

Navigating the standalone UI
I started by clicking on the first URL here:
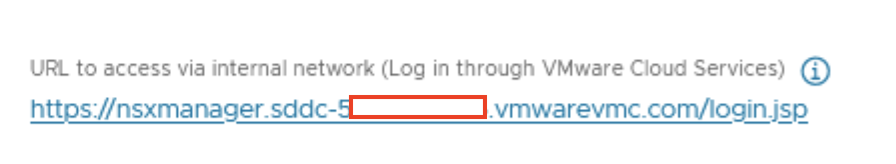
After a few seconds, I am presented with the NSX Manager UI:
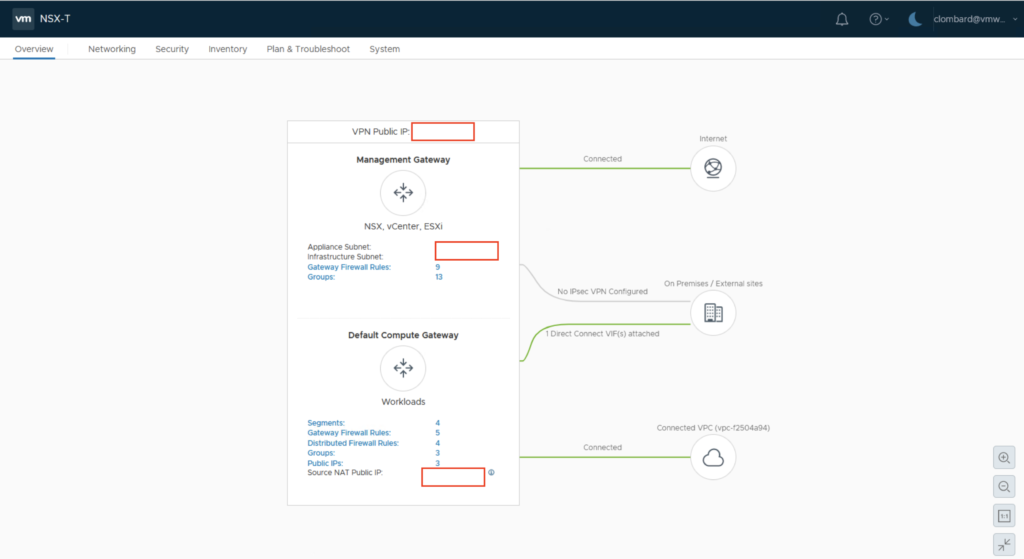
Networking tab
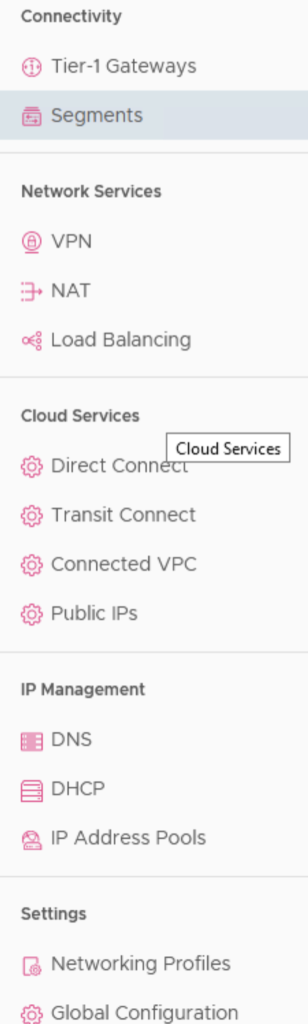
This tab will give you access to configuring the Connectivity options, Network Services, Cloud Services, IP Management, or Settings.
Basically the settings can be accessed in read only or read/write mode.
Keep in mind you will not have more rights or permissions to modify settings than if you were editing it from the CSP Console.
VPN and NAT options are accessible with same capabilities as from CSP console.
The Load Balancing options is there and is usable only if you have Tanzu activated in your cluster.
For example, for the Direct Connect you can change the ASN number or enable VPN as a backup.
For Transit Connect, you can have a look at the list of Routes Learned or Advertised.
Public IPs allow for requesting new IP addresses for using them with HCX or a NAT rule.
Let see what’s possible to do from the Segments menu.
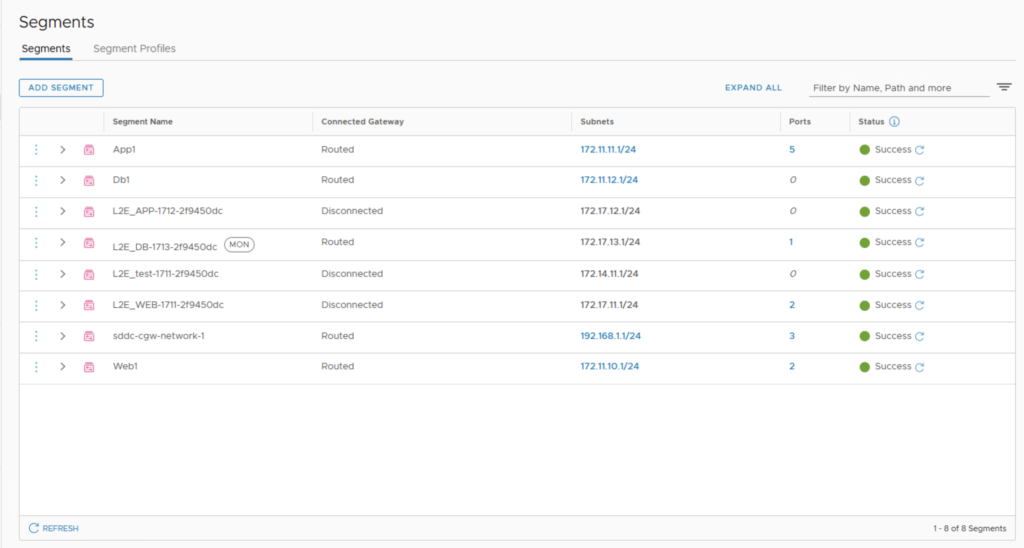
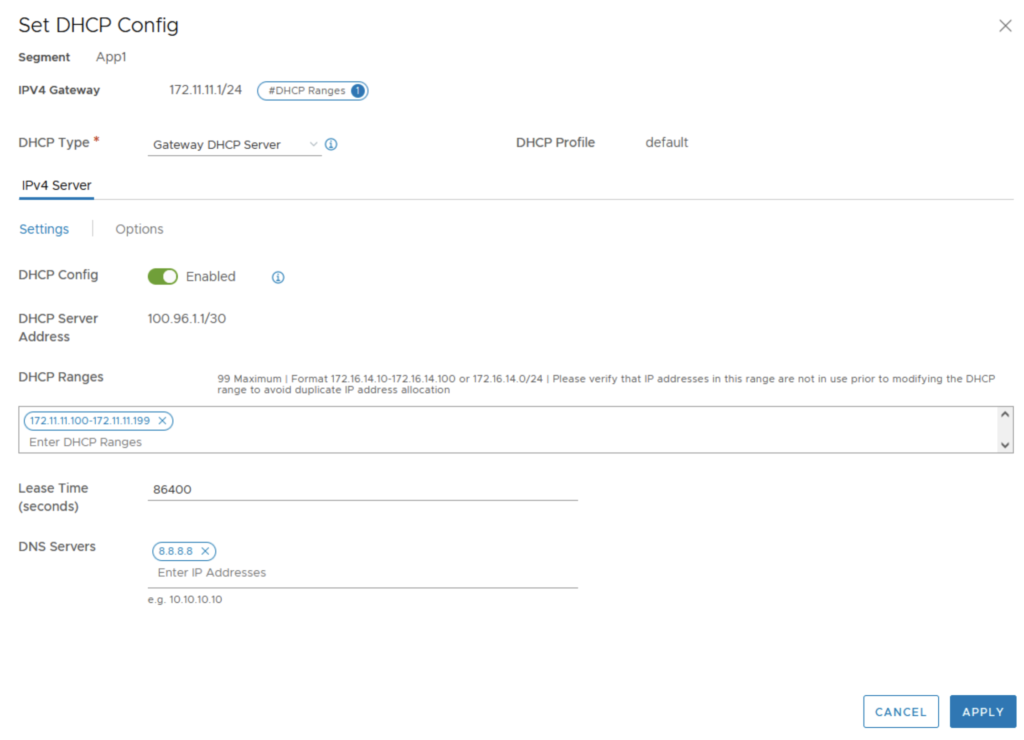
I was able to edit the settings of one of my segment DHCP configuration.
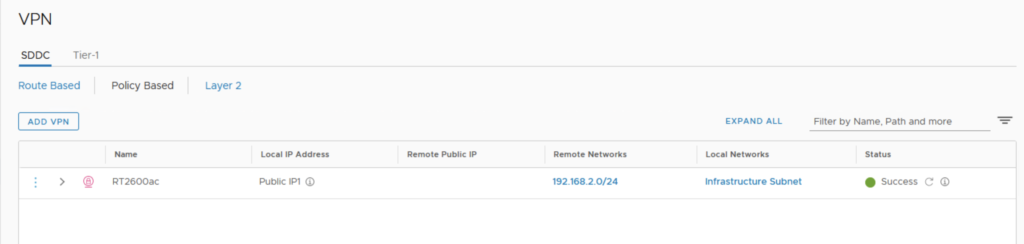
I was also able to edit my Policy Based VPN settings.
All the other options are reflecting what we can already do in the CSP Console.
Security tab
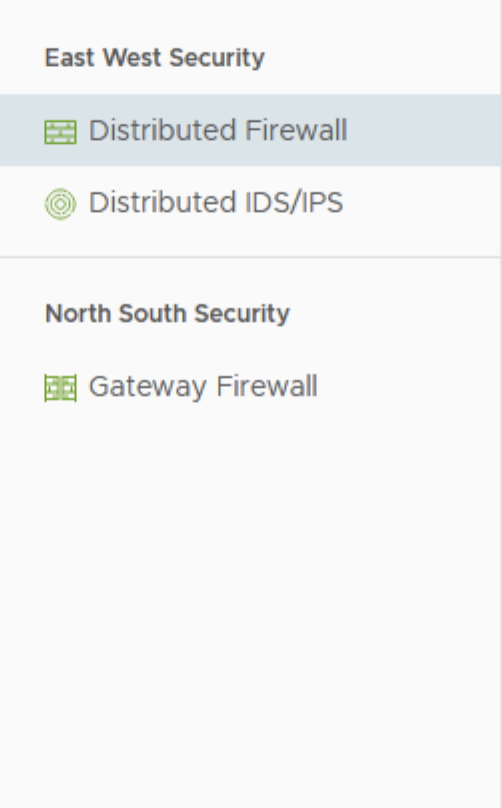
This Menu is divided into two parts:
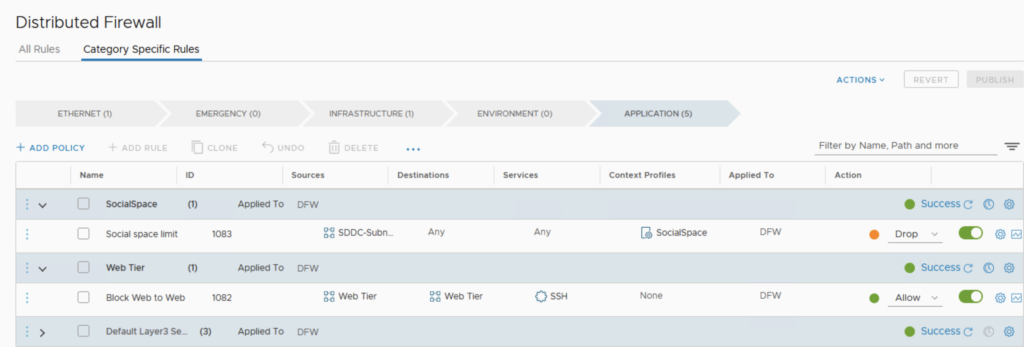
- East-West Security that gives access to the Distributed Firewall rules and Distributed IDS/IPS configuration,
- North-South Security covers internal traffic protection and the Gateway Firewall rules settings.
Nothing really interesting here, it’s pretty much the same as from the CSP Console as you can see here:
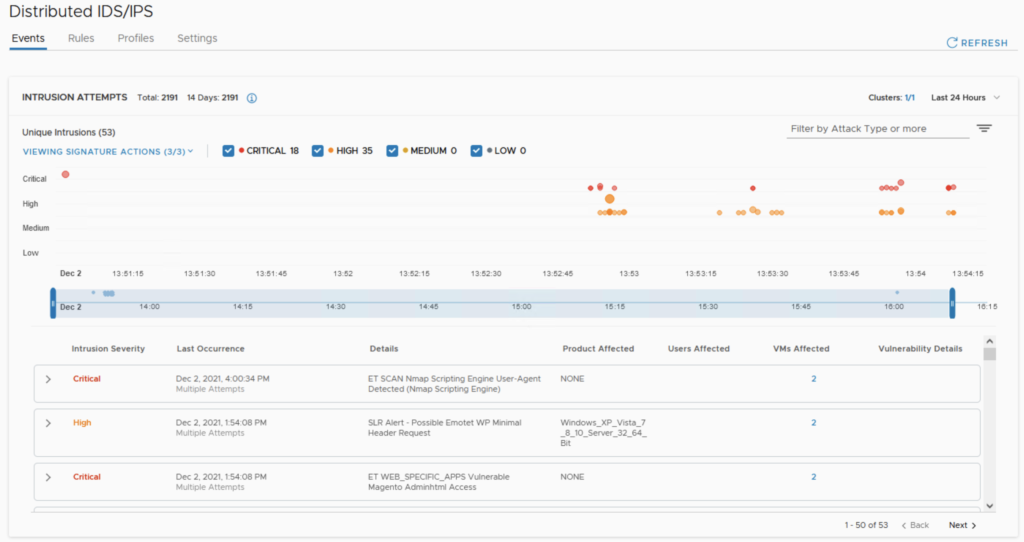
On the Distributed IDS/IPS, I can review the results of my previous penetration testing that I did in my previous post.
Inventory tab
This tab is covering:
- Services: this where you’ll configure new protocol and services you want to leverage in the FW rules
- Groups: group of Virtual Machines for Management FW rules and Compute Gateway rules
- Context Profiles: you can basically add new FQDNs useful for the DFW FQDN filtering feature, AppIDs for Context Aware Firewall rule, and set up Context Profiles.
- Virtual Machines: list all the VMs running an attached to segments with their status (Stopped, Running, …)
- Containers: will show Namespaces and Tanzu Clusters.
Plan and Troubleshoot tab
The tab is covering:
- IPFIX: this where you’ll configure new protocol and services you want to leverage in the FW rules
- Port Mirroring: this permits to setup a target collector VM and then replicate and redirect all trafic from a logical port switch to it for analysis purpose
- Traceflow: very nice feature to monitor and trouble shoot a trafic flow between two VMs and to analyze the path of the trafic flow.
The last one is a feature not existing on the current VMC on AWS CSP Console and which is to my opinion worth having a look at.
Traceflow option
Let’s have a look more deeply into what this brings onto the table in my next post.
Stay tune!
One thought on “NSX Manager Standalone UI for VMC on AWS”