In this blog post I will talk about how vRealize Log Insight Cloud can be leveraged to monitor the Audit logs of Vmware Cloud on AWS.
Introduction to vRLIC
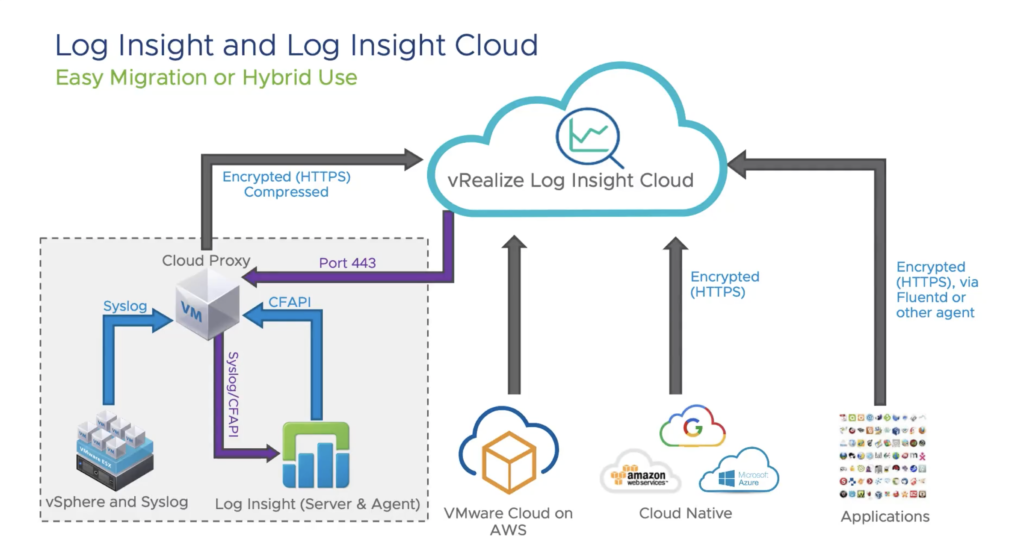
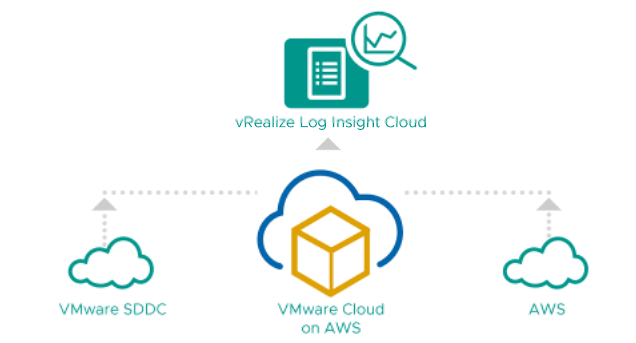
vRealize Log IC is able to ingest data coming from multiple sources including Physical infrastructure, VMware Cloud on AWS as well as Cloud providers platform or applications running on any cloud. It gives customers the choice on multiple ingestion options like :
- Remote Cloud proxy: a small virtual appliance deployed on-premise to collect data from any physical or virtual on-premises hardware as well when redirecting logs from vRLIC to an external SIEM (like Splunk)
- VMC integration: any subscribed customer will get audit and security logs automatically redirected to a cloud instance of vRLIC unlike the NSX-T firewall logs that need to be activated
- REST API integration: allow to push logs from any log agent like Fluentd or Logstash running on applications running anywhere but can also use the vRLI agent and Cloud proxy
- Cloud native AWS, GCP or Azure integration: for instance AWS CloudWatch or Cloudtrails logs can be redirected to vRLIC through a lambda function. Azure or GCP can send several log types through HTTPs.
There is nothing to configure with VMC on AWS and once customers gets access to vRealize Log Insight cloud, they are automatically getting all the audit and firewall logs coming from VMC.
The Cloud Proxy
The Cloud proxy is basically responsible for sending logs coming from on-prem to the vRealize Log Insight Cloud.
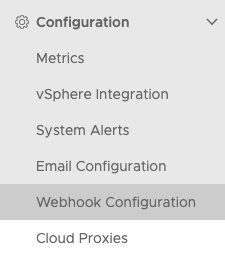
It can be installed from the vRLIC instance by going to the Cloud Proxies available under the Configuration Menu.
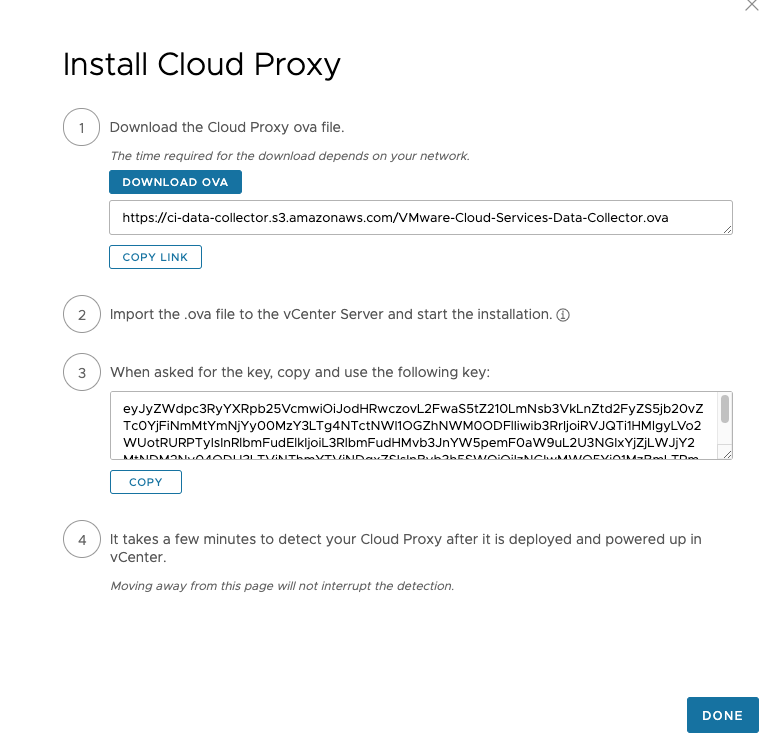
Once you click you will be redirected to a pop window with a link to directly download the proxy OVA. A specific key is also generated and it will have to be used when you deploy the OVA on-premise in order to identify it towards the vRLIC instance.
Content Packs
vRealize Log insight Cloud leverage the concept of Content Packs to add additional dashboards and alerts settings preconfigured to enrich the default configuration.
Content packs are a bundling of dashboards, queries, alerts, and extracted fields to make it easier to consume log data coming from your applications and infrastructure. vRealize Log Insight Cloud offers content packs for VMware products such as VMware Cloud on AWS, NSX-T, NSX-V, vSphere, vSAN, vRealize Operations, vRealize Network Insight, and Workspace One just to name a few.
There are content packs for infrastructure like firewalls and switches, and applications such as Apache, MySQL, SQL Server, and Active Directory.
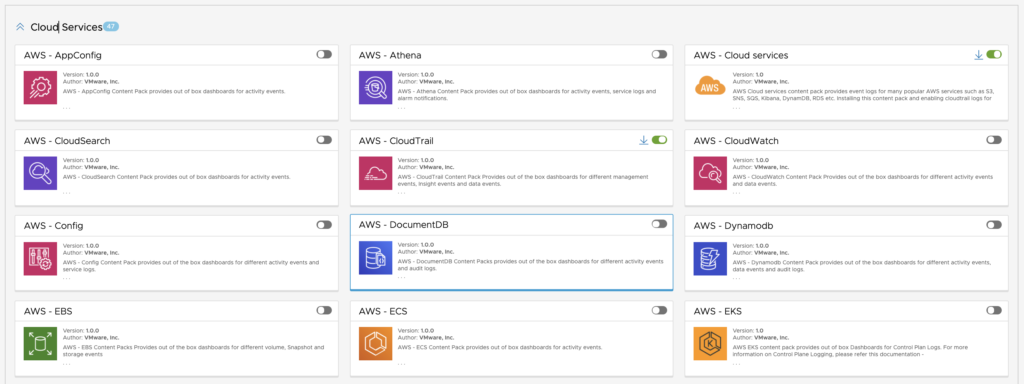
There are also a content pack for popular AWS Cloud Services such as S3 and RDS. I will cover this topic in a next post. We have added recently support for Azure And Google Cloud as well.
There are currently around 77 Content Packs available in vRealize Log insight cloud today which makes it a very relevant platform when it comes to monitor Cloud native applications, virtual infrastructure, as well as on-premise computing and networking devices.
Log Sources
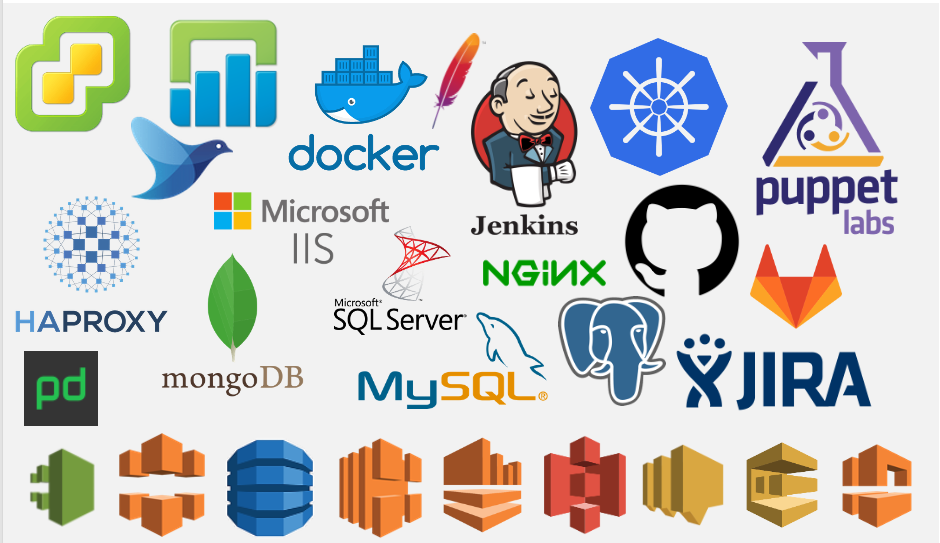
There are a lot of different log sources ranging from infrastructure, applications, development tools, middleware, AWS, Azure, GCP.
The first thing you do when you want to add a new log sources is to verify the steps to add the log source. In order to do it just go to the Log Sources page of vRLIC here:
and select the relevant solutions you want to collect logs from.
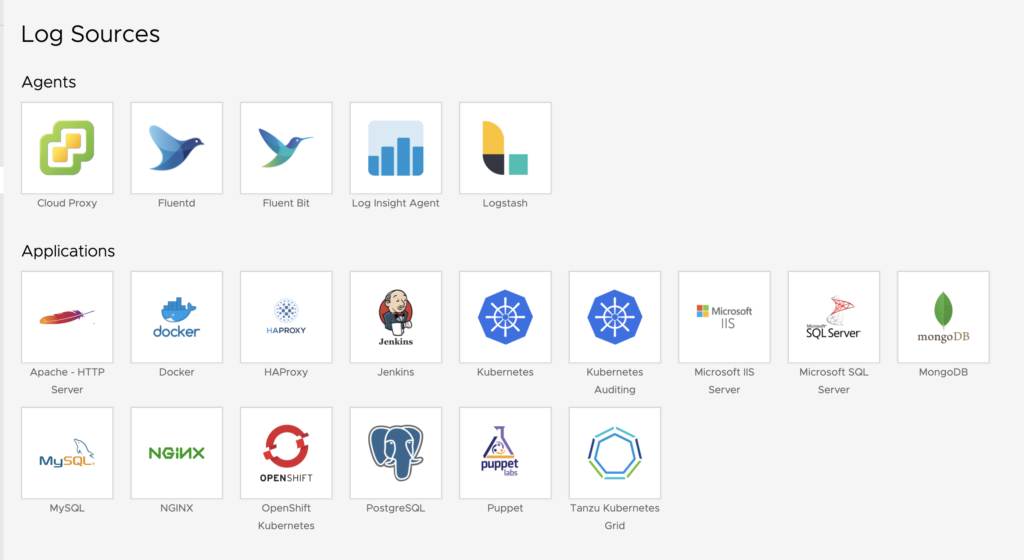
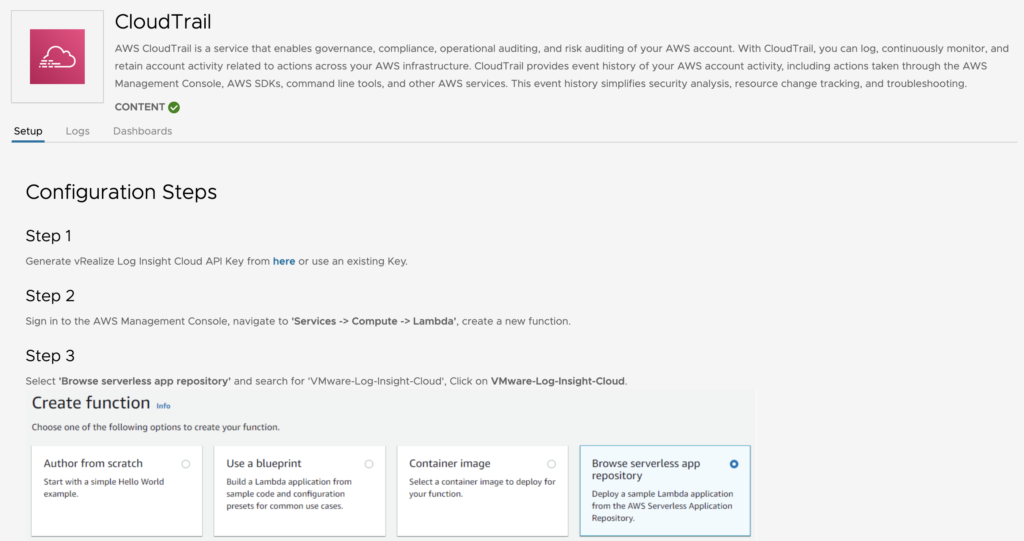
Let’s say you want to add AWS CloudTrail logs into Log Insight Cloud. What you need to do is just select the CloudTrail Log sources and you will be guided by the configuration guide listing all the required steps. Very easy!
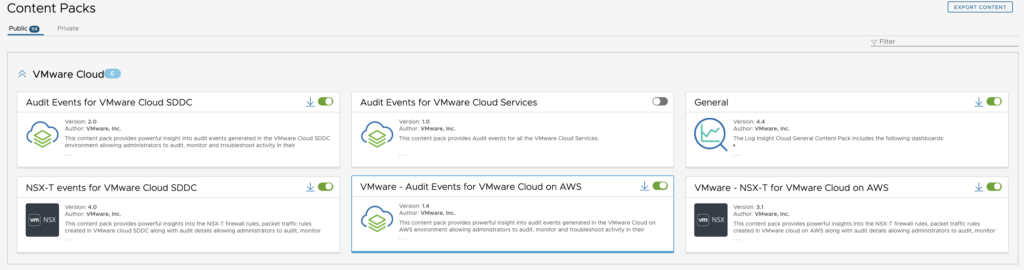
Out of the Box content for VMC on AWS
There are a lot of interesting content that customers are entitled to when subscribing to the VMC on AWS service including VMC on AWS specific Dashboards, Queries and Alerts.
The following 3 Content Packs are enabled by default and they can be consumed as soon as logs are starting flowing into vRLIC.
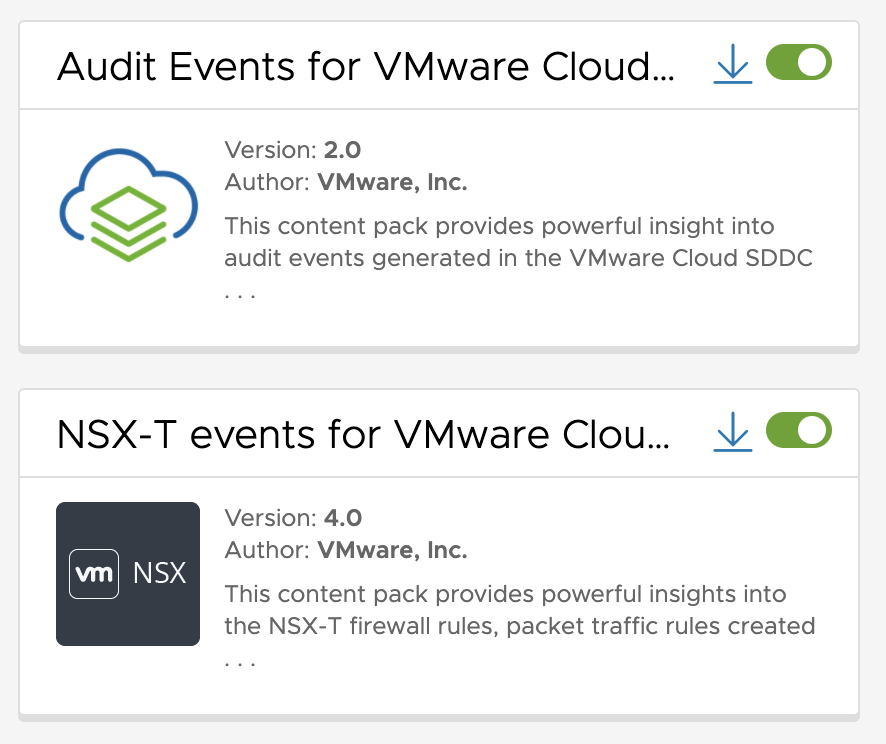
As for now the latest versions of the Content Packs are :
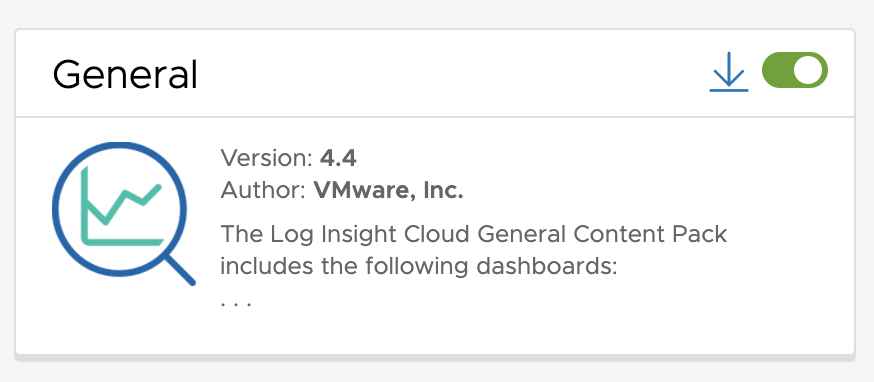
- 4.4 for the General
- 2.0 for the Audit Events for VMware Cloud on AWS
- 4.0 for the NSX-T for VMware Cloud on AWS
In the free edition, customer will not be able to activate any other Content Packs.
What logging content comes with VMware Cloud?
When the customer subscribe to the VMC on AWS service the following content are enabled by default :
- Audit Logs: is a Core service for VMC customers that monitors VMC deployments for potential security breaches or internal misuses of infrastructure as well as give visibility into VMC deployment, including which users is doing what and when, which users created or deleted a VM or accessed the CSP portal,
- Firewall Logs: allow to gain visibility on the NSX-T Firewall or DFW events and monitor traffic being allowed or dropped. This mainly helps customers to tune the firewall security policies and monitor the dropped packets or the traffic flow that is needed for security.
Please note that the Firewall Logs are only available in the paid version.
Be aware that as a customer, you will not have access to all the messages coming from VMC on AWS like you would from your on-premise infrastructure. We have agreement with AWS that we won’t be exposing any of the underlying hardware and infrastructure to customers.
But don’t worry ! That’s not really of a problem as VMC on AWS is a managed service where VMware is taking care of the infrastructure including the hosts and the clusters. So we do have SREs in the back end that have access to the logs to make sure everything is ok.
What are the AUDIT logs for VMC?
Basically what is collected as log messages is well documented by VMware through the specific filters that are applied at VMC level and it can be checked from the documentation here.
It includes the raw log messages coming from ESXi, vCenter, and User-driven Activity Events as well as the NSX-T Audit and Packet Log Events. We also redirected all the VMC Notification Gateway Events.
Audit Events
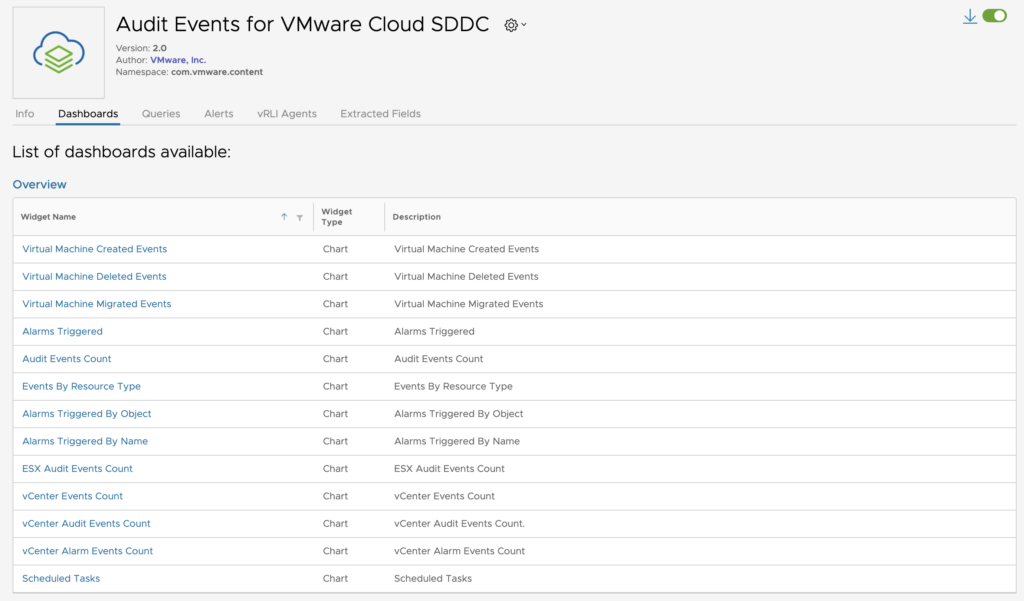
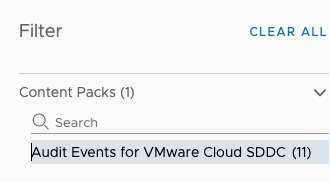
The Audit Events for VMware Cloud on AWS Content Pack comes with 11 dashboards.
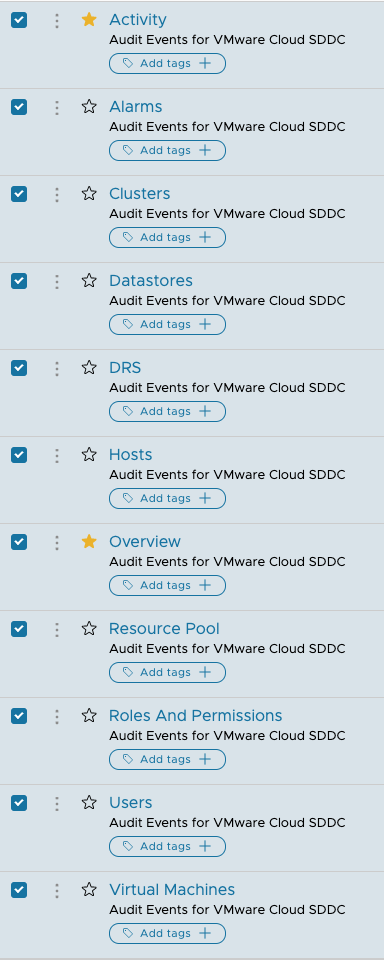
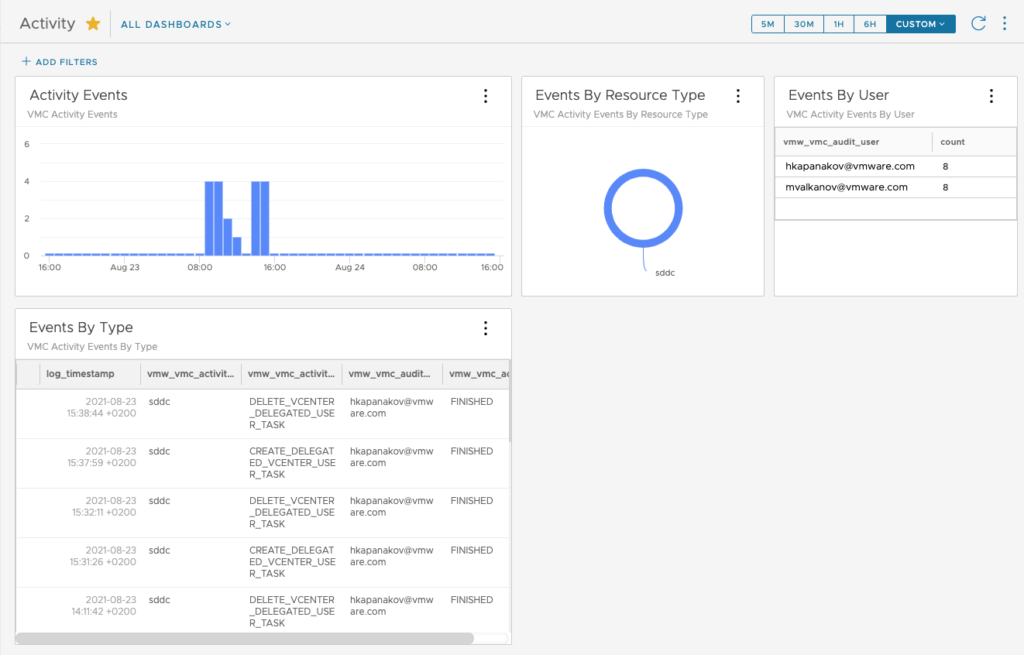
The Activity dashboard is all related to activity logs from VMC and it includes the major changes made to your SDDC classified by Type, by User or by Resource Type.
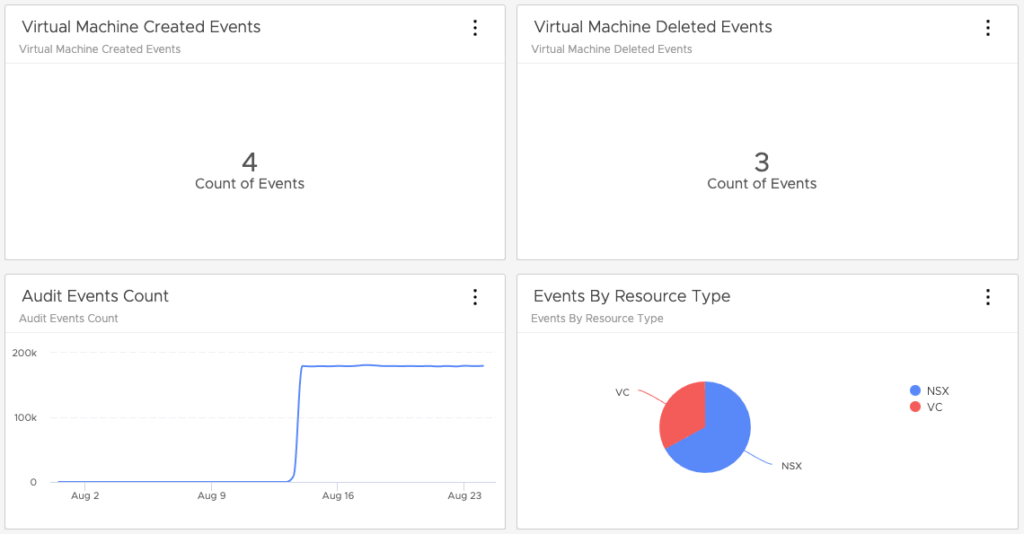
The one I found the most interesting is the VMC Overview dashboard as it gives a unique view on the multiple Events that affect the SDDC and the Alarms that have been triggered.
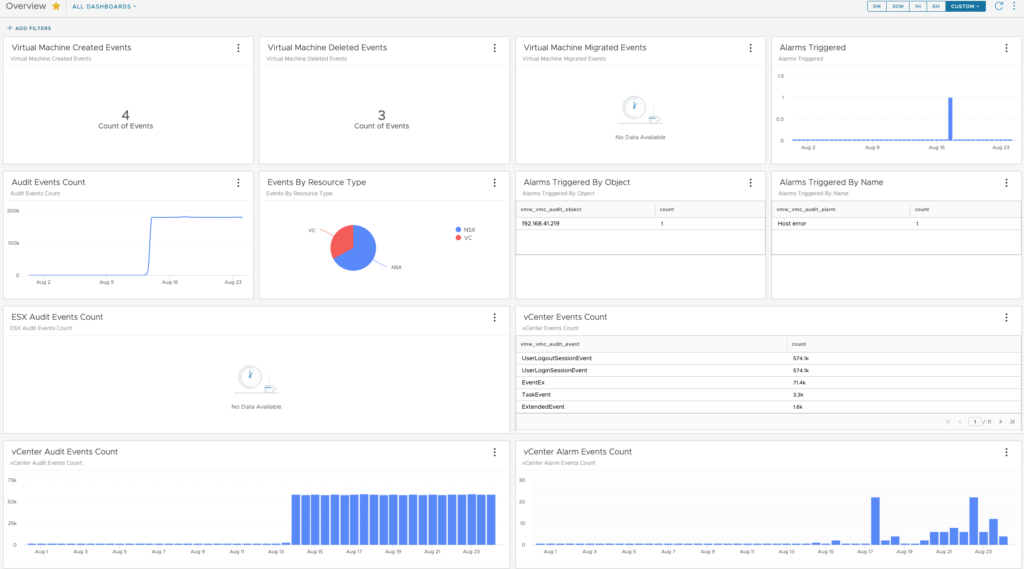
This is where you can list the number of VM created and deleted for instance.
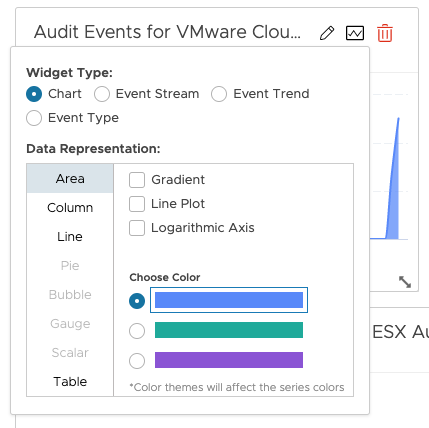
In the Dashboard workbench, you can edit the dashboard and adapt the visualisation to your needs.
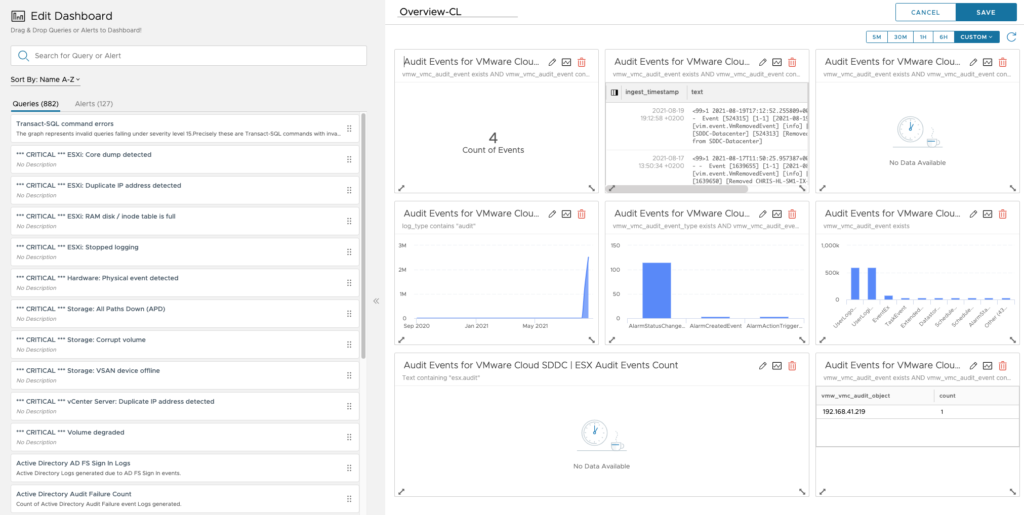
Editing a widget into a dashboard allow for modifying the look and feel and to switch from multiple visualisation and different colors.
You can also remove or add widgets by dragging and dropping a widget from the left to the right.
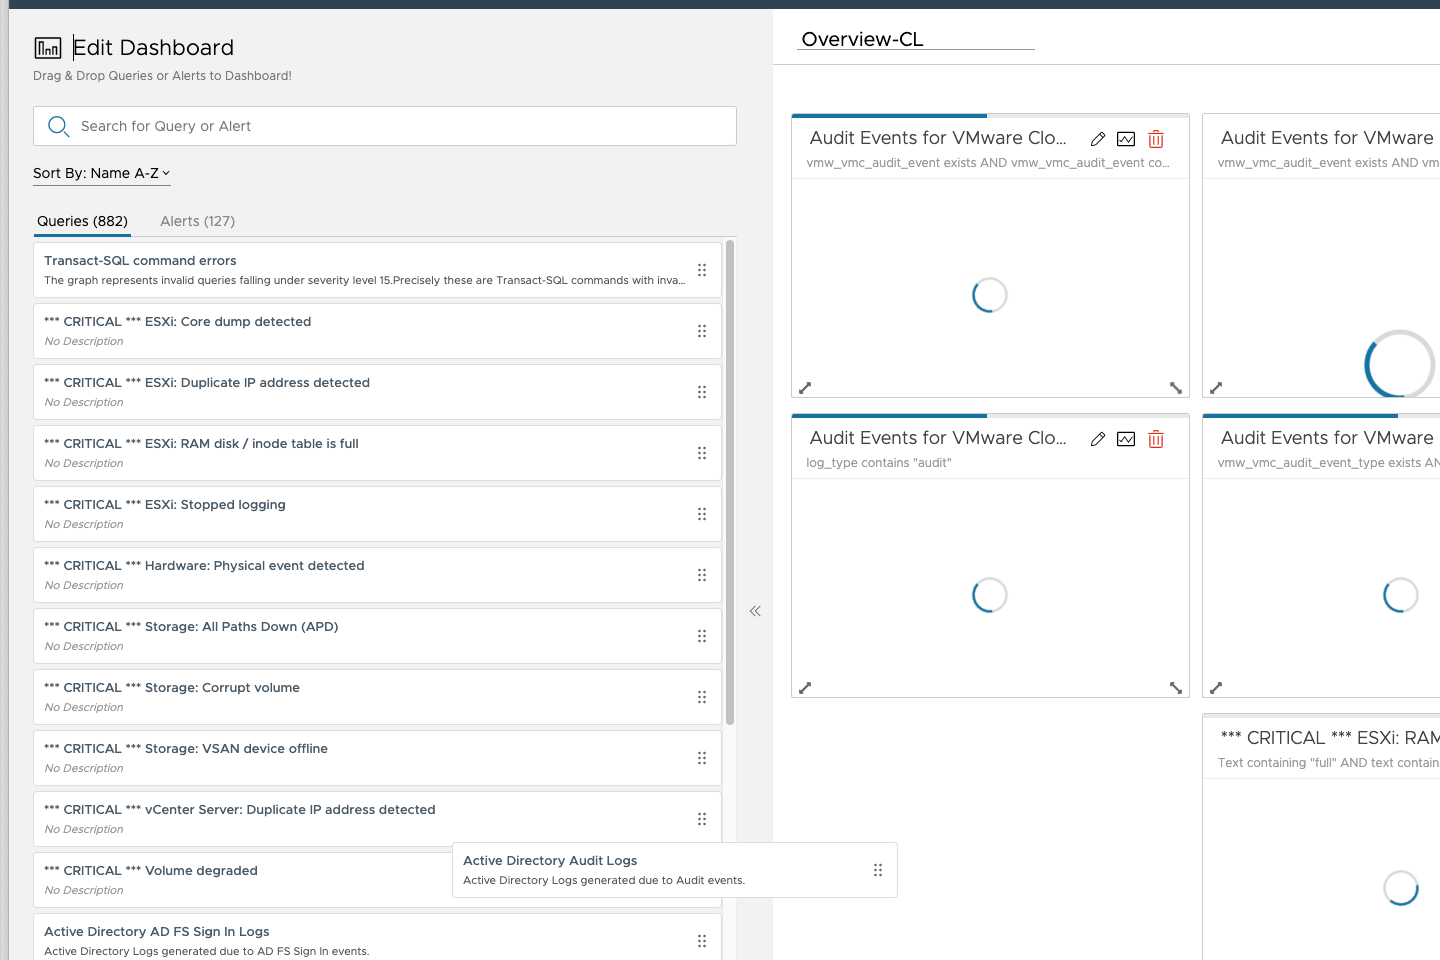
Once you have modified the dashboards, you can save it to a new name.
Be aware that Content pack dashboard are read only and need to be cloned prior to editing.
NSX-T events
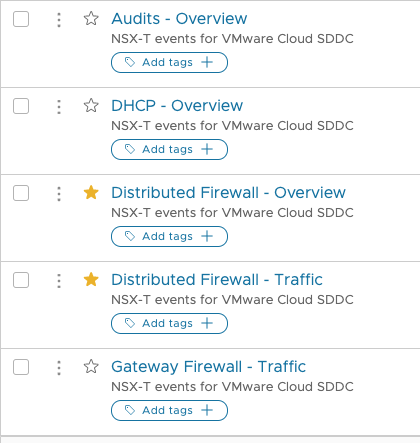
The NSX-T Content Pack comes with 5 dashboards covering Distributed FW events (overview and traffic), Gateway Firewall log messages, NSX-T Audit events and a specific one for DHCP events.
It covers all the major changes made to the Gateway and distributed Firewall inside the SDDC.
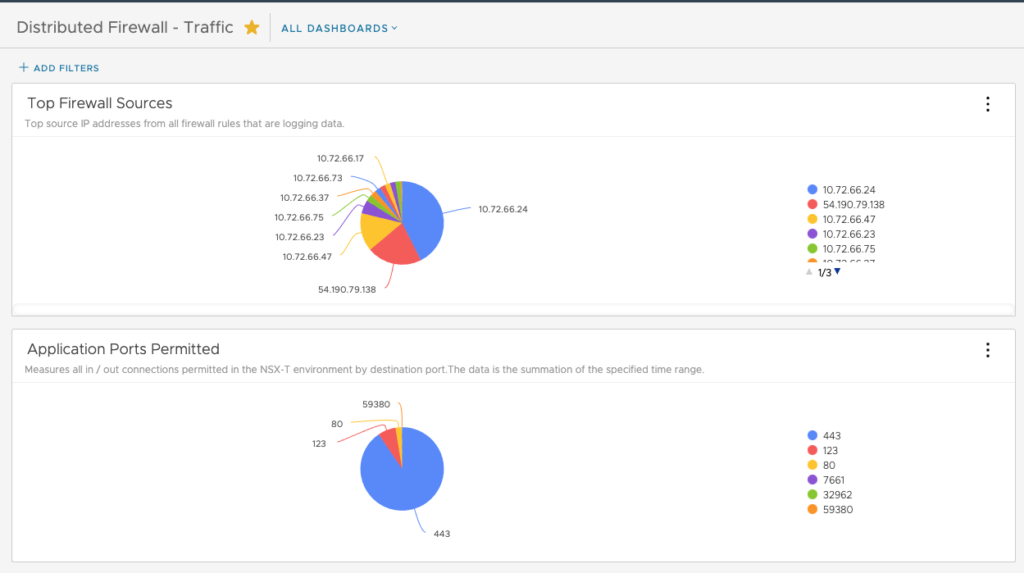
Here is an example of the type of logs you can get from the Distributed Firewall – Traffic dashboard including the traffic traversing the FW including Sources or Application Ports Permitted:
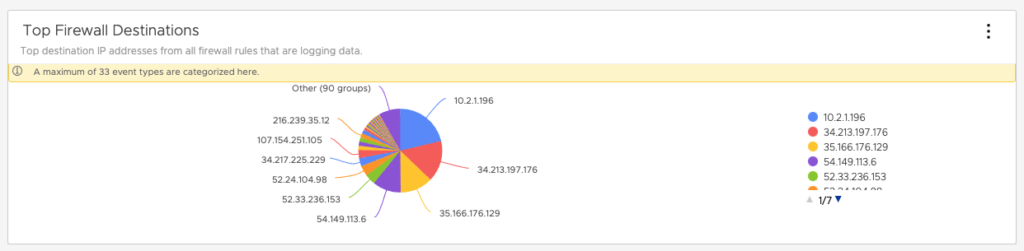
or also FW Destinations:
Exploring Logs for VMC on AWS
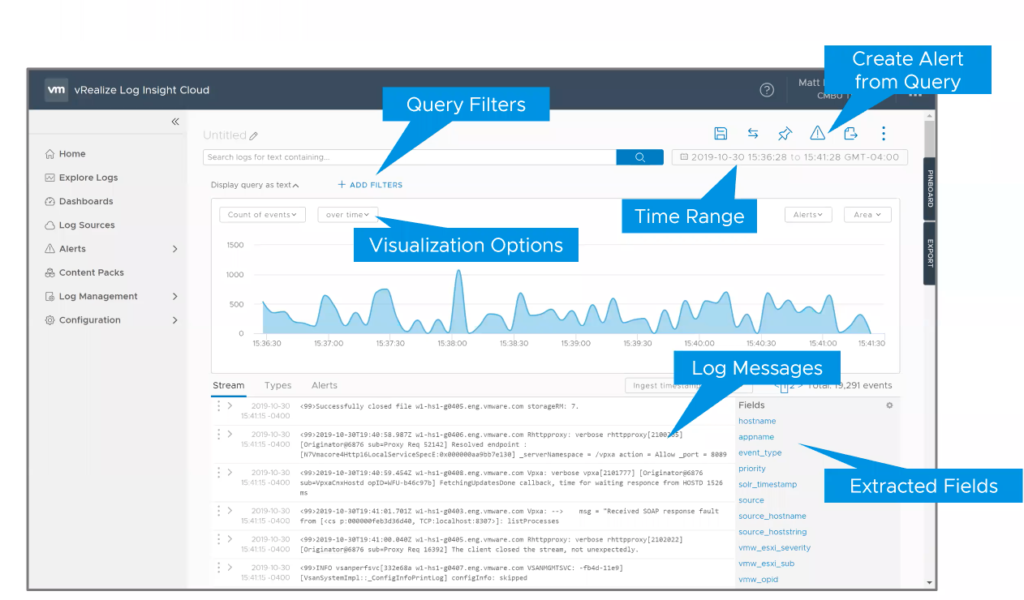
Log explorer is where you can see the log stream, log types and alerts. This is where you can filter based on specific criteria and view the details of the log messages as well as create queries for custom dashboards and alerts.
You can also extract fields from the log explorer view. The Log Explorer is gonna show on the right hand side the fields which are the string of text that are in the log message.
Extracted fields are really powerful as they can be leverage in the ADD filters to help you filter log messages based on a particular value. That could be for example to see logs for a particular host or an application.
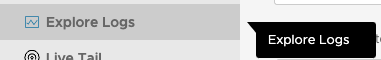
In order to access the Log Explorer, you just have to Select Explore Logs from the drop down menu on the left to access it.
If you don’t filter on anything all the log messages coming from all the hosts will be displayed.
There are different ways to view messages by leveraging several filtering options. Common language search is supported and you don’t have to be an expert in regular expression (REGEX is also supported however).
Whenever you create a query by using a query filter you can create an alert from it and get an email notification when a particular log message is detected.
Once you have created your queries you can favorite, save, compare and pin them and come back later to the specific queries that you have saved.
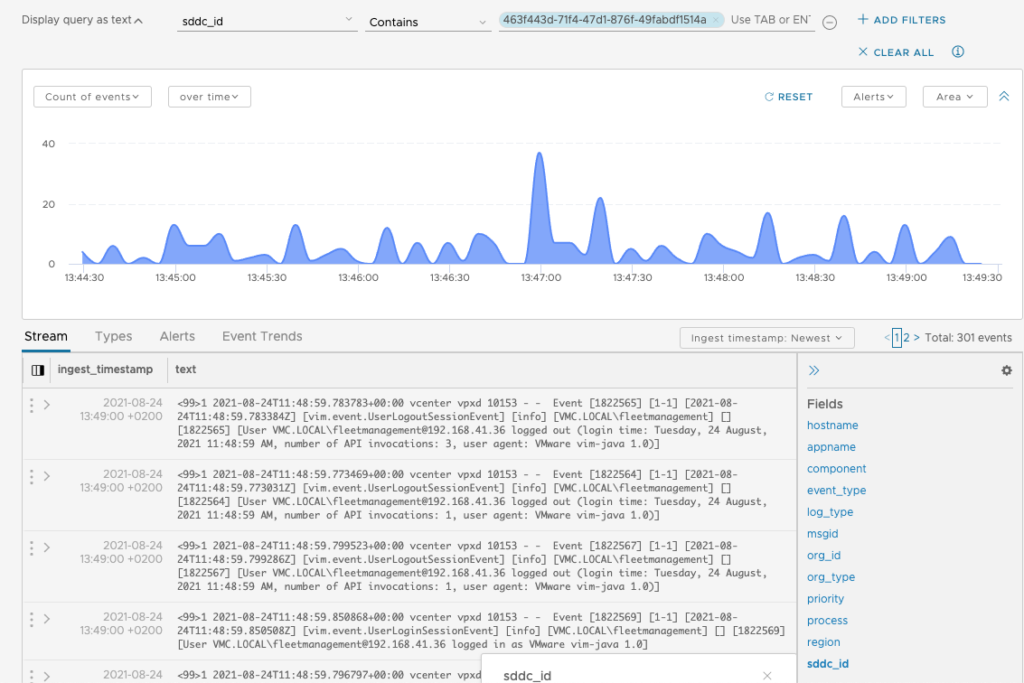
All VMware Cloud on AWS Logs will have an associated SDDC_ID. If multiple SDDC’s exist, each will have a unique ID. So you can limit the view to a specific SDDC by entering the SDDC ID as a filter for example.
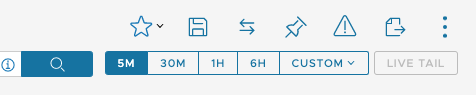
The time frame is by default 5 minutes and it must sometimes be updated to reflect older log messages and avoid empty dashboards. You can specify a custom Time Range if you want to filter on a larger time frame like multiple hours, days or months. Even when increasing the time window some widgets will remain empty and that is completely normal in a healthy configuration.
There are different ways to view messages:
- Event Types display the most frequently occurring events
- Alerts is specifically focusing on the alerts present in log messages
- Event Trends is there to help you better understand the trends in the environment.
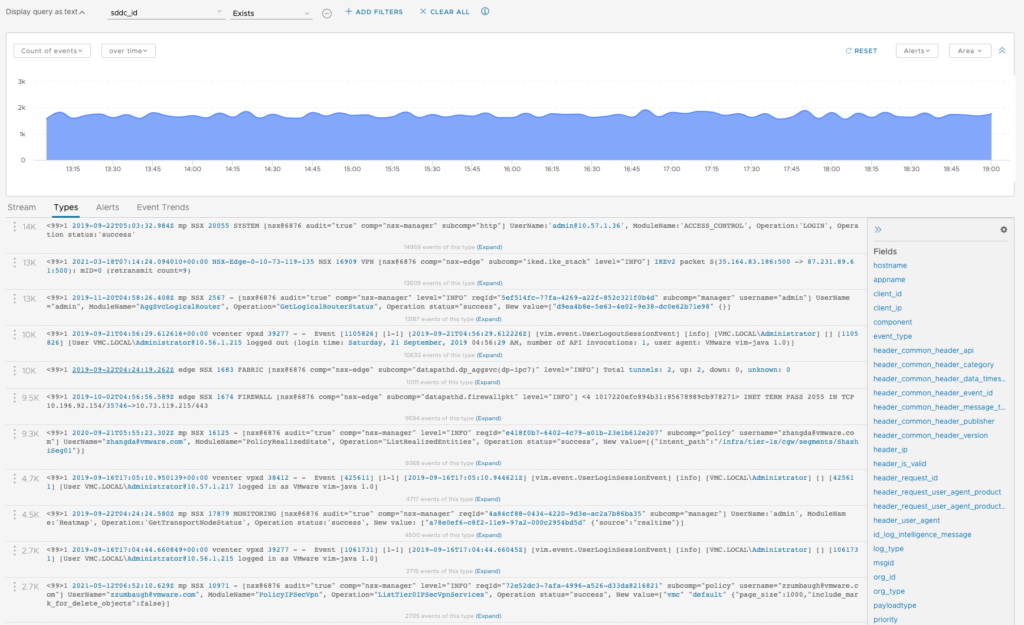
So you have the option to view log messages by Event Types and limit the view to Alerts present in the log message.
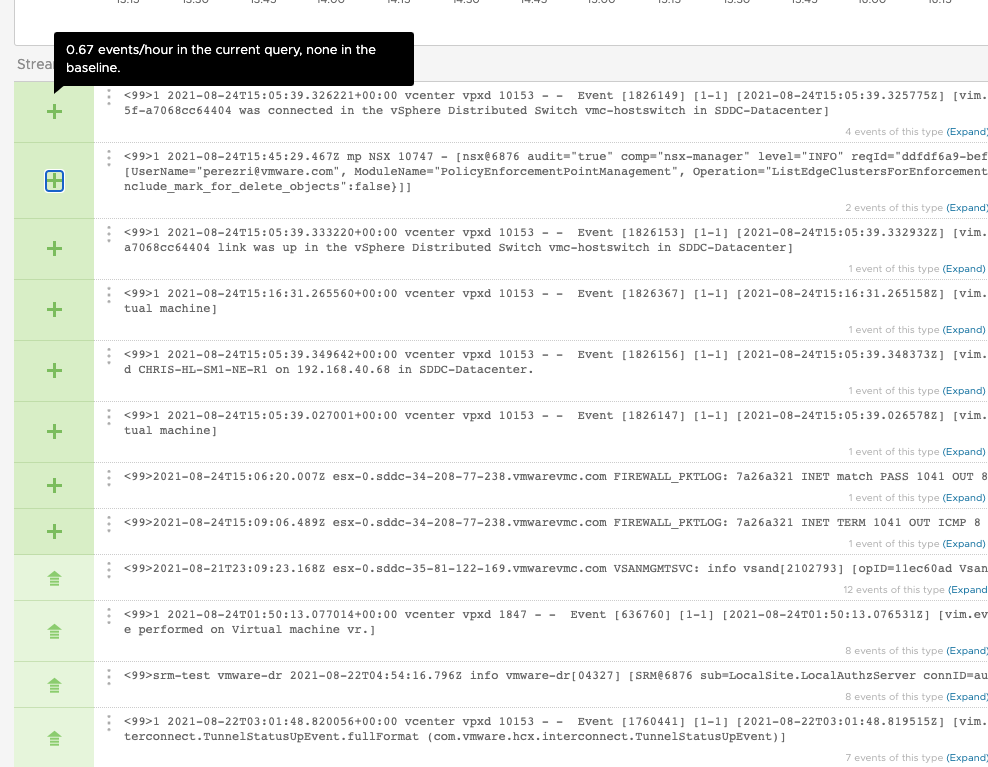
Event Trends is delivering the information on the frequency (event per hour) on specific Events. This is doing a log comparison again the user defined window (time frame) by grouping log messages into categories. This is leveraging an AI driven log categorization to group related log messages into log types.
To access the information on the event frequency, just go over the related events as displayed bellow:
Enabling SDDC alerts
Some thing to call out is that by default none of the VMC Alerts that are coming from the VMC Content Packs are enabled.
In order to enable some of the main Alerts for VMC, you first need to switch to the Alert definitions Menu and toggle the switch on the left that it appears in green.
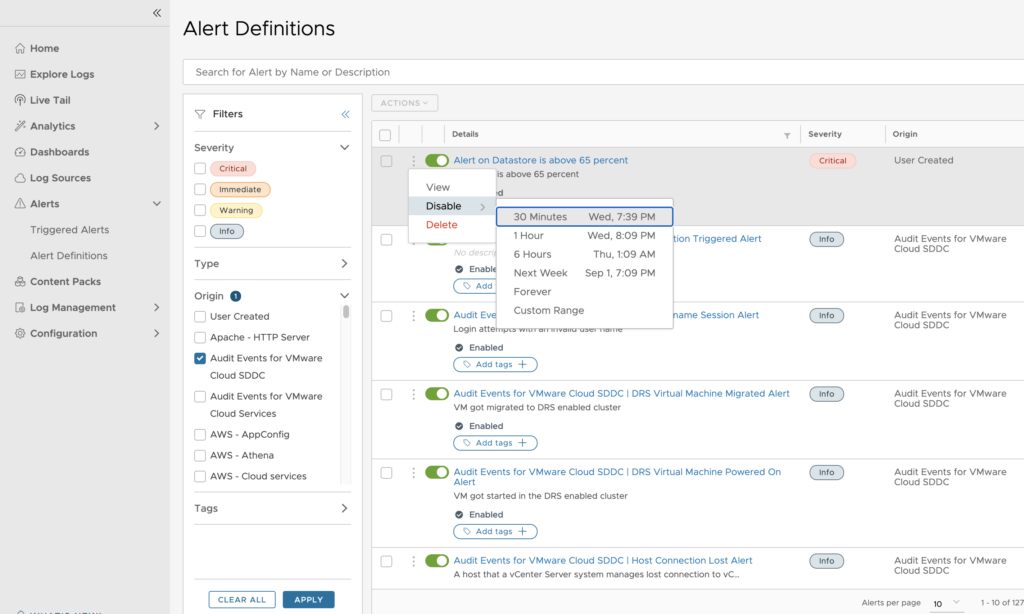
You can always disable an alert for a certain amount fo time if you will.
There is also a Triggered Alerts area where you can view the Alerts that were triggered over a specific time and it is represented through a Graph on which you can adjust the Time Frame.
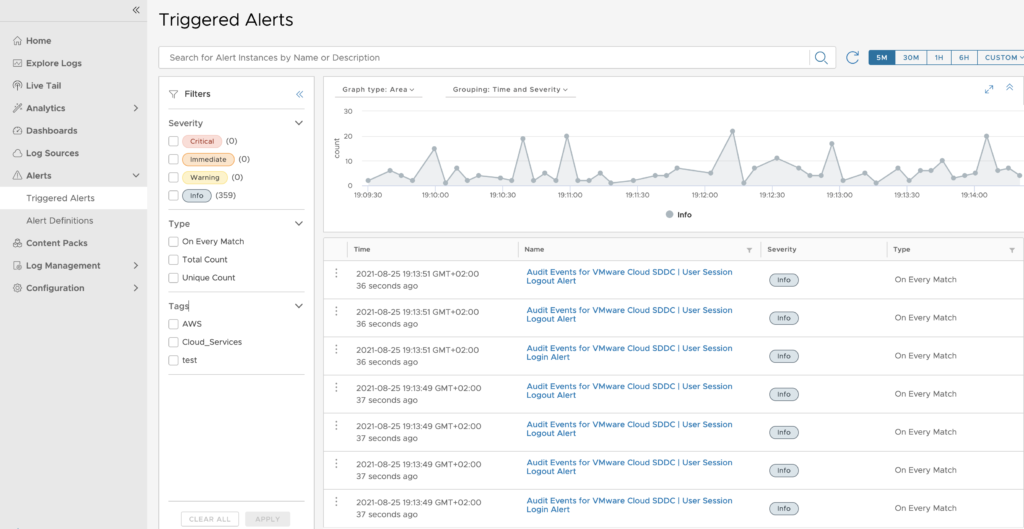
You can also view the details of the Alerts in a log explorer at the bottom of the window like here:
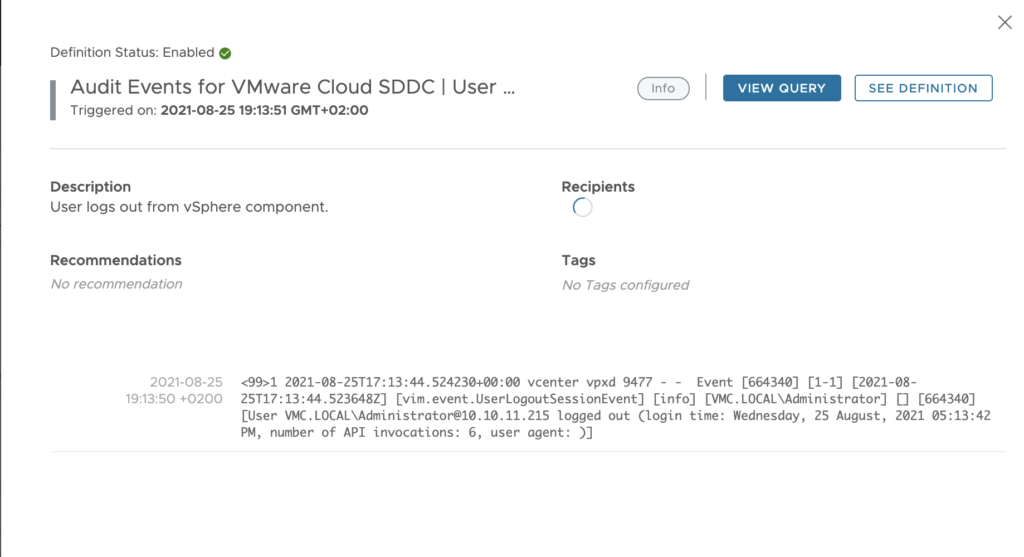
and you can also update an Alert definition if you have created it.
Adding Notification to an Alert
Once you have activated an Alert you might want to change the notification options and add specific emails, webhooks like slack channels as recipient.
There are several other attributes that you can update in the Alerts settings, here are a list of them:
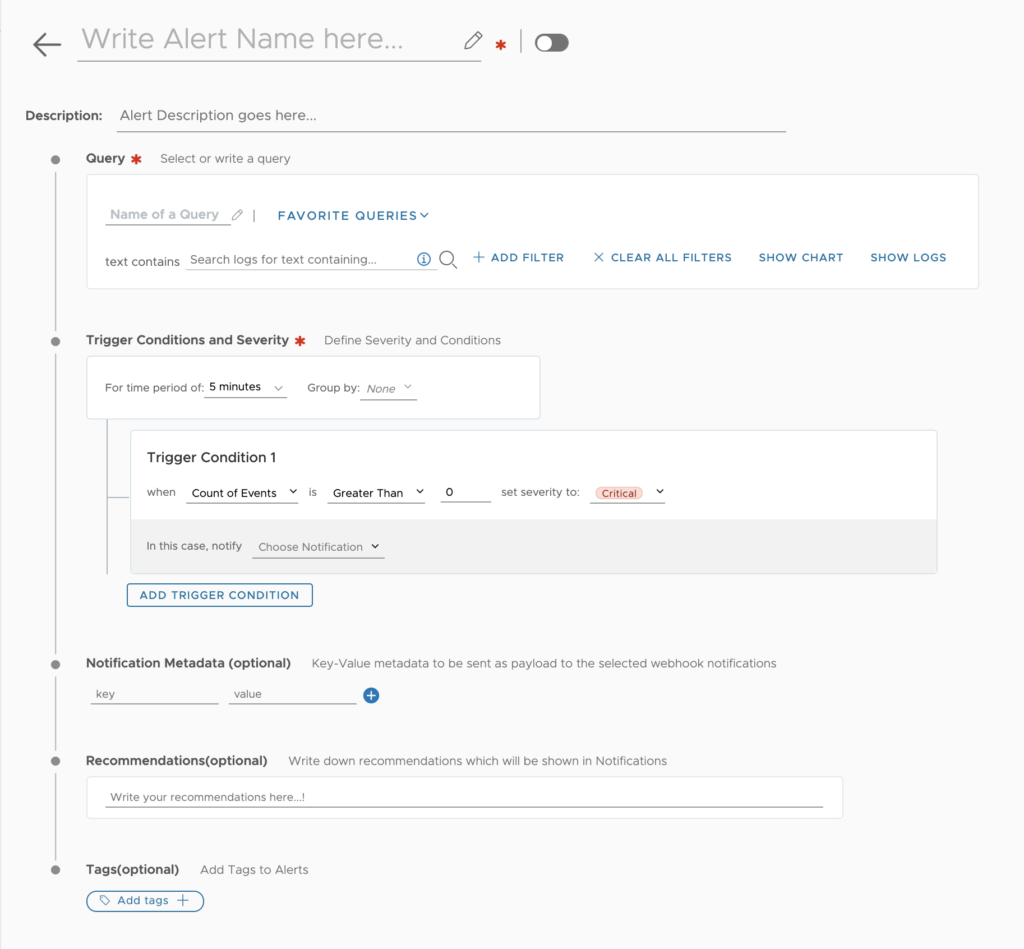
- Query: what is the search criteria for generating the alert
- Trigger Conditions and Severity
- Notify: this is where you will choose the specific method to get the notification event it can be Email, or a Webhook (Slack, PagerDuty,Datadog)
- Metadata: key value pair to be sent as payload to the webhook
- Tags: add a tag to an alert to easily search for same type of Alerts
Please note that you can only add tags, or add metadata, or change the notification recipient in the Content Pack Alerts.
Conclusion
vRLIC is really a valuable product for DAY 2 operations in VMC on AWS. In my next posts I will show you some examples on how we can leverage the logging and alerting features of the product.
Stay tune!